
Topic 3.6A
Sinusoidal Function Transformations
In 3.5 we measured sinusoids — amplitude, midline, period, and frequency — and saw how and in control the height of a wave. But every function in 3.5 still had period . Real periodic data almost never cycles every units: the pedal from 3.1 takes 1.2 seconds per turn. This note adds the constant that controls the period and then puts all the pieces together to write equations. Sliding a graph left or right — the last transformation — is the topic of 3.6B.
9 MIN READ6 IDEAS32 PROBLEMS14 flashcards
One Constant for Each Transformation
Remember from 1.12: multiplying a function's outputs stretches its graph vertically, adding to the outputs shifts it up or down, and multiplying the input stretches or squeezes it horizontally. A sinusoidal function uses exactly these moves.
| Constant | Transformation | What it controls |
|---|---|---|
| a | vertical dilation (plus a reflection if a < 0) | amplitude = |a| |
| d | vertical translation | midline: y = d |
| b | horizontal dilation by a factor of 1/|b| | period = 2π/|b| |
How b Changes the Period
Why is the period ? The sine function completes one cycle while its input runs from 0 to . In the input is , so one cycle is finished when reaches — that is, when (for ).
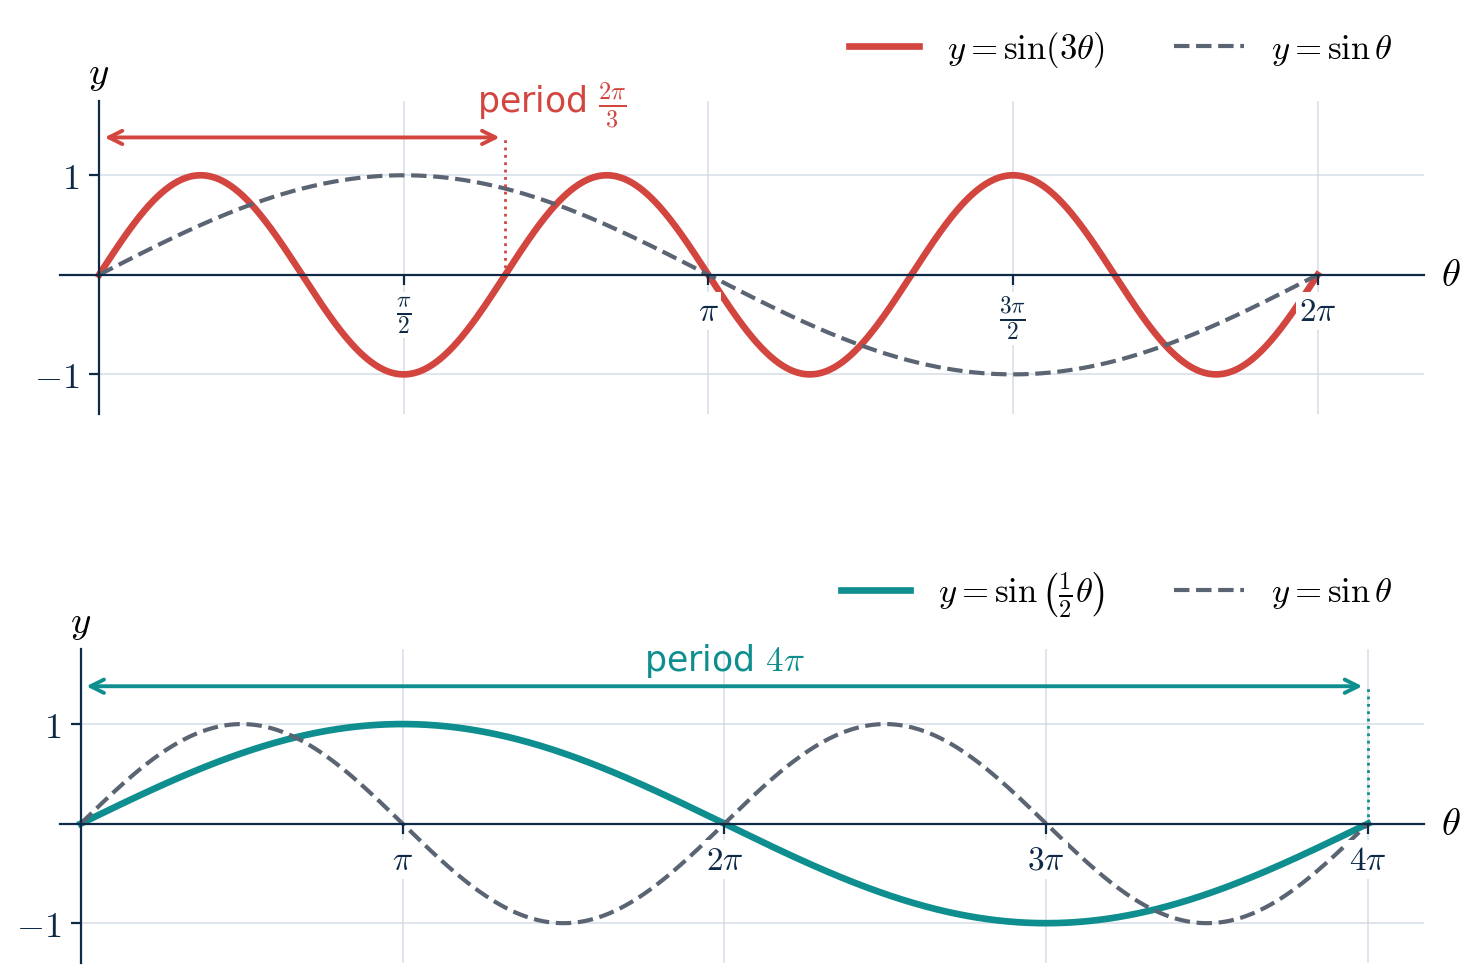
Top: packs three cycles into , so each cycle has length . Bottom: stretches one cycle to length .
So a larger means a SHORTER period — the wave is squeezed together — while between 0 and 1 means a longer period. The frequency, , grows as grows: more cycles fit into each unit of input.
COMMON MISTAKE
"In , the period is 3." or "…the period is ."
is not the period, and you do not multiply by it. tells you how many times faster the input runs. With , the input reaches when is only , so each cycle is three times SHORTER: period = .
Sanity check with the picture: the graph of fits three full waves between 0 and .
Periods that are not multiples of π
In real situations the period is usually a plain number of seconds, days, or hours. Solving period = for gives
For example, a period of 10 needs . That is why so often appears inside the parentheses of a real-world model: it is there to cancel the in .
Quick check
What is the period of ?
Reading an Equation
Worked example
Example 1. For , find the amplitude, midline, period, frequency, maximum value, and minimum value. Then describe how the graph starts at .
- 01
Match the form : , , and .
- 02
Amplitude: . Midline: . Maximum value: . Minimum value: .
- 03
Period: . Frequency: 1/() ≈ 0.053.
- 04
At the graph is on its midline: . Because a is negative, the graph is flipped, so it heads DOWN from the midline first and reaches its minimum, 3, a quarter period later, at .
Worked example
Example 2. A quantity is modeled by , where is measured in hours. Find the amplitude, midline, period, and frequency.
- 01
, , and . Amplitude: 7. Midline: , so the quantity swings between and .
- 02
Period: hours. The π's cancel, leaving a plain number.
- 03
Frequency: cycle per hour.
Graphing with Quarter-Period Steps
Remember from 3.5: neighboring key points of a sinusoid are a quarter period apart. So once you know the period, divide it by 4 and step along the horizontal axis.
Worked example
Example 3. Sketch one period of , starting at .
- 01
Amplitude 1.5 and midline , so the maximum is 3.5 and the minimum is 0.5.
- 02
Period: . Quarter period: . So the key points are at , , , , and .
- 03
A cosine graph with starts at its maximum, then follows the pattern max → midline → min → midline → max.
θ 0 π/6 π/3 π/2 2π/3 y 3.5 2 0.5 2 3.5 - 04
Plot the five points and connect them with a smooth wave that bends toward the midline (3.4). Repeat the cycle to extend the graph.
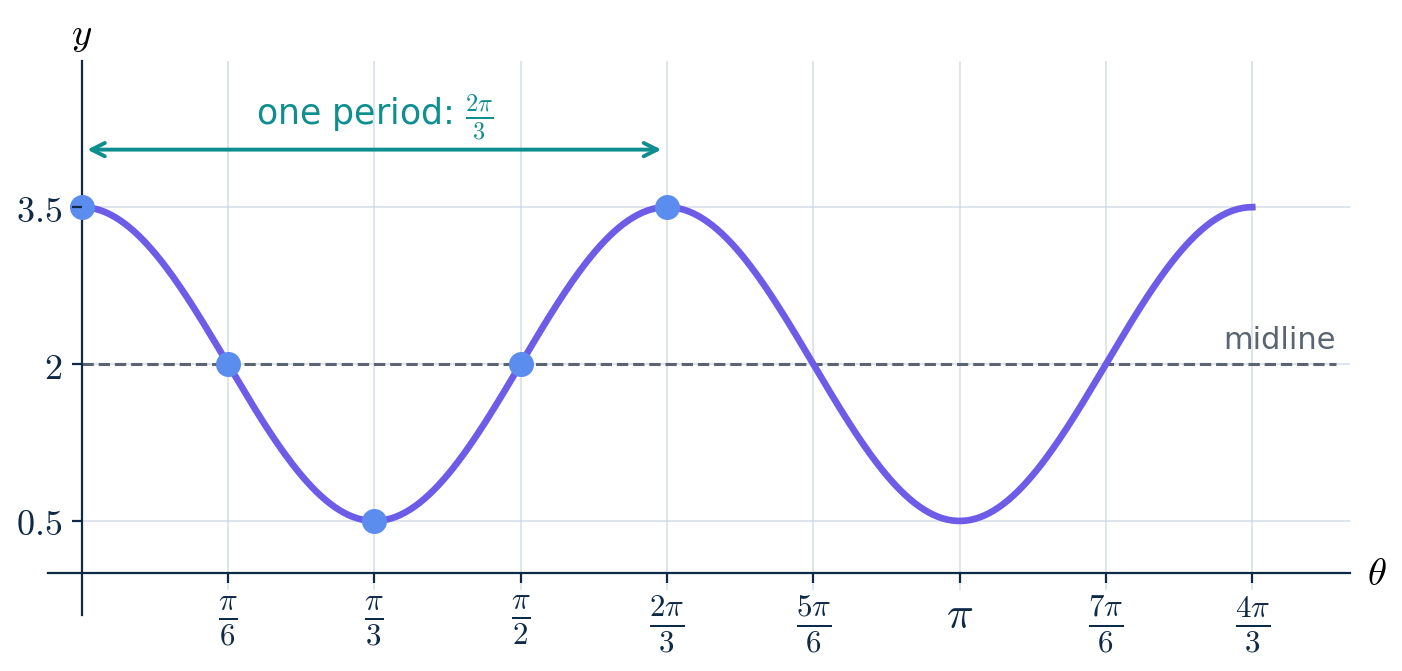
: key points every , one full period every .
COMMON MISTAKE
"The period is , so I plot points at 0, , , …"
Those are only the maximums — one per period. They all have the same height, so they show nothing about the shape in between. Always step by a QUARTER period ( here) to catch the midline crossings and the minimum.
Writing an Equation from the Features
Going the other way, each feature gives one constant: the midline gives , the amplitude gives , and the period gives . Where the graph starts decides whether to use sine or cosine and what sign a should have.
CONCEPT
Choosing the starting function (no horizontal shift)
Starts at a maximum → with .
Starts at a minimum → with .
Starts on the midline, going up → with .
Starts on the midline, going down → with .
Worked example
Example 4. A sinusoidal function has maximum value 11, minimum value 3, and period 8, and it has a maximum at . Write an equation for .
- 01
Midline: . Amplitude: .
- 02
÷ period = .
- 03
The graph starts at a maximum, so use cosine with a positive a: .
- 04
Check: , the maximum ✓. , the minimum, half a period later ✓.
COMMON MISTAKE
"The period is 8, so ."
is not the period. has period — far shorter than 8. Use ÷ period = .
Check by plugging in: with , , back at the maximum after exactly one period. ✓
REAL-LIFE EXAMPLE
The pedal equation, at last
In 3.1 we described the right pedal of a bike: crank arm 17 cm, crank center 28 cm above the ground, one turn every 1.2 seconds, starting at the lowest point.
Midline 28 → . Amplitude 17 → . Period 1.2 → .
It starts at a minimum, so use cosine with a negative a: .
Check against the 3.1 table: , , , , . Every value matches.
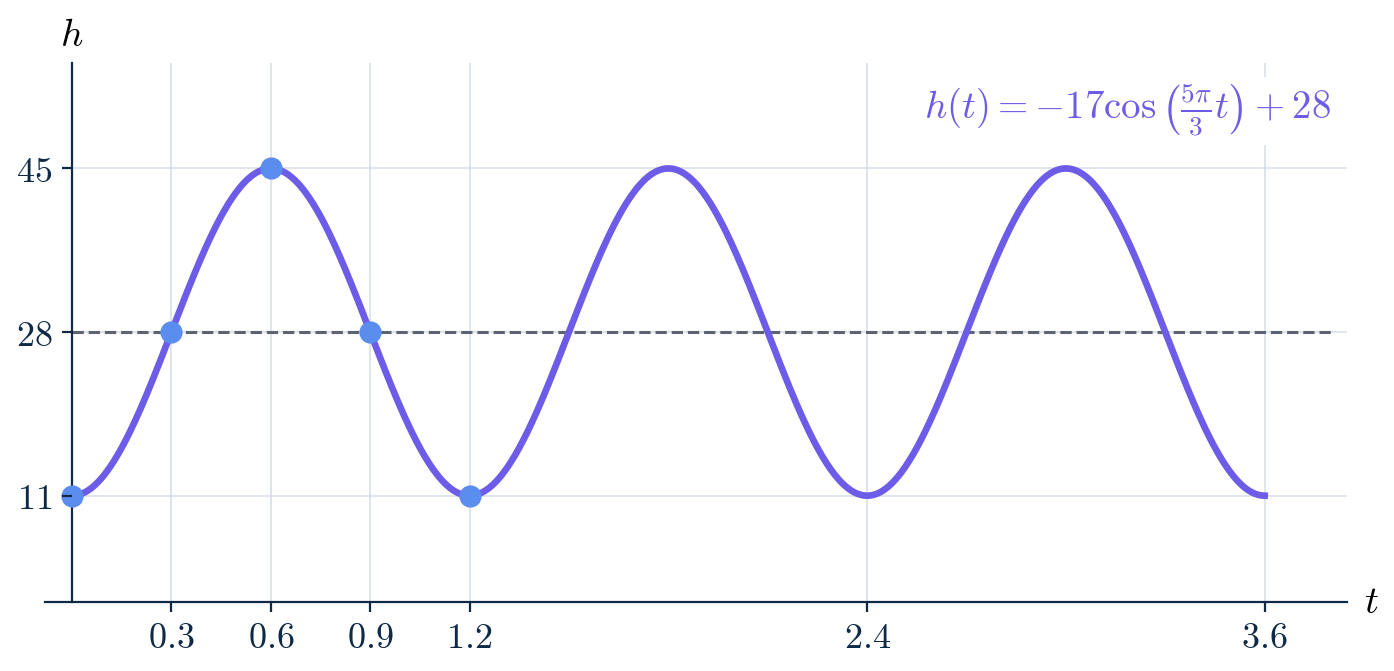
The pedal from 3.1, now described by an equation.
Quick check
A sinusoid has midline , amplitude , period , and a maximum at . Write an equation.
Common slips
"In , the period is 3." or "…the period is ."
is not the period, and you do not multiply by it. tells you how many times faster the input runs. With , the input reaches when is only , so each cycle is three times shorter: period = .
Sanity check with the picture: the graph of fits three full waves between 0 and .
"The period is , so I plot points at 0, , , …"
Those are only the maximums — one per period. They all have the same height, so they show nothing about the shape in between. Always step by a quarter period ( here) to catch the midline crossings and the minimum.
"The period is 8, so ."
is not the period. has period — far shorter than 8. Use ÷ period = .
Check by plugging in: with , , back at the maximum after exactly one period. ✓
Lock it in
Try the flashcards
14 cards · Sinusoids, Sine or cosine graph?
Recap card
6 lines to re-read the night before.
- 01
and : a is a vertical dilation, a vertical translation, a horizontal dilation.
- 02
Amplitude , midline , period , frequency .
- 03
Larger → shorter period. is not the period: ÷ period.
- 04
To graph, step by a quarter period and follow the pattern of key points.
- 05
To write an equation, find , , and from the features; the starting point picks sine or cosine and the sign of a.
- 06
Coming up in 3.6B: horizontal shifts (phase shifts), and writing equations for graphs that start anywhere.