
Topic 3.5
Sinusoidal Functions
In 3.4 we saw that the sine and cosine graphs have the same wave shape. This note gives that family of waves a name, and it introduces four measurements that describe any member of the family: period, frequency, amplitude, and midline.
8 MIN READ5 IDEAS33 PROBLEMS21 flashcards
Read this first
30 sec
- 01
Max to next max = 1 period. Max to next min = ½ period. Midline to next max or min = ¼ period.
What Is a Sinusoidal Function?
CONCEPT
Sinusoidal function
A sinusoidal function is any function that can be built from using additive and multiplicative transformations — stretching, shrinking, reflecting, and sliding the graph.
Its graph is called a sinusoid. Every sinusoid has the same basic wave shape as .
The cosine function is sinusoidal, because its graph is exactly the sine graph slid units to the left:
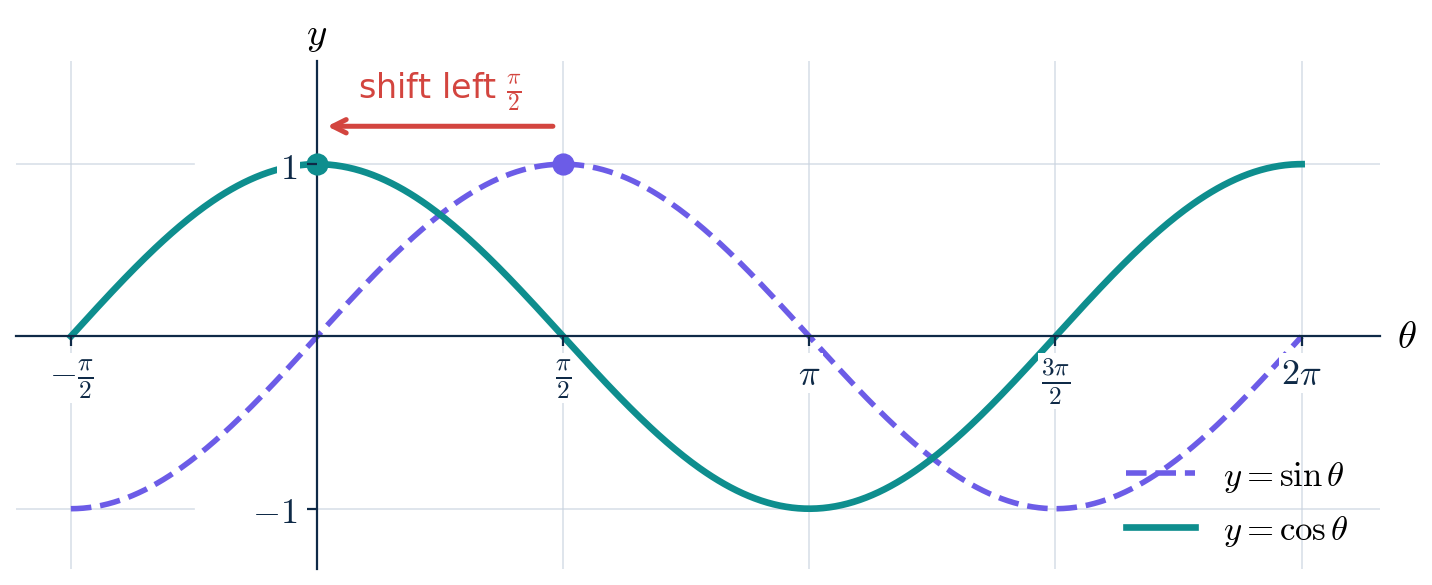
Every point of the sine graph moves to the left and lands on the cosine graph. The maximum at moves to .
Why does this work? Rotating a point a quarter turn counterclockwise around the origin moves it to . So the height of the point a quarter turn ahead, , equals the horizontal position of the original point, .
Symmetry
Remember from 3.2B: the angle is the reflection of across the x-axis, which sends a point to . The x-coordinate stays the same and the y-coordinate changes sign. That gives each graph a symmetry:
CONCEPT
Odd and even
, so sine is an odd function. Its graph is symmetric about the origin.
, so cosine is an even function. Its graph is symmetric about the y-axis.
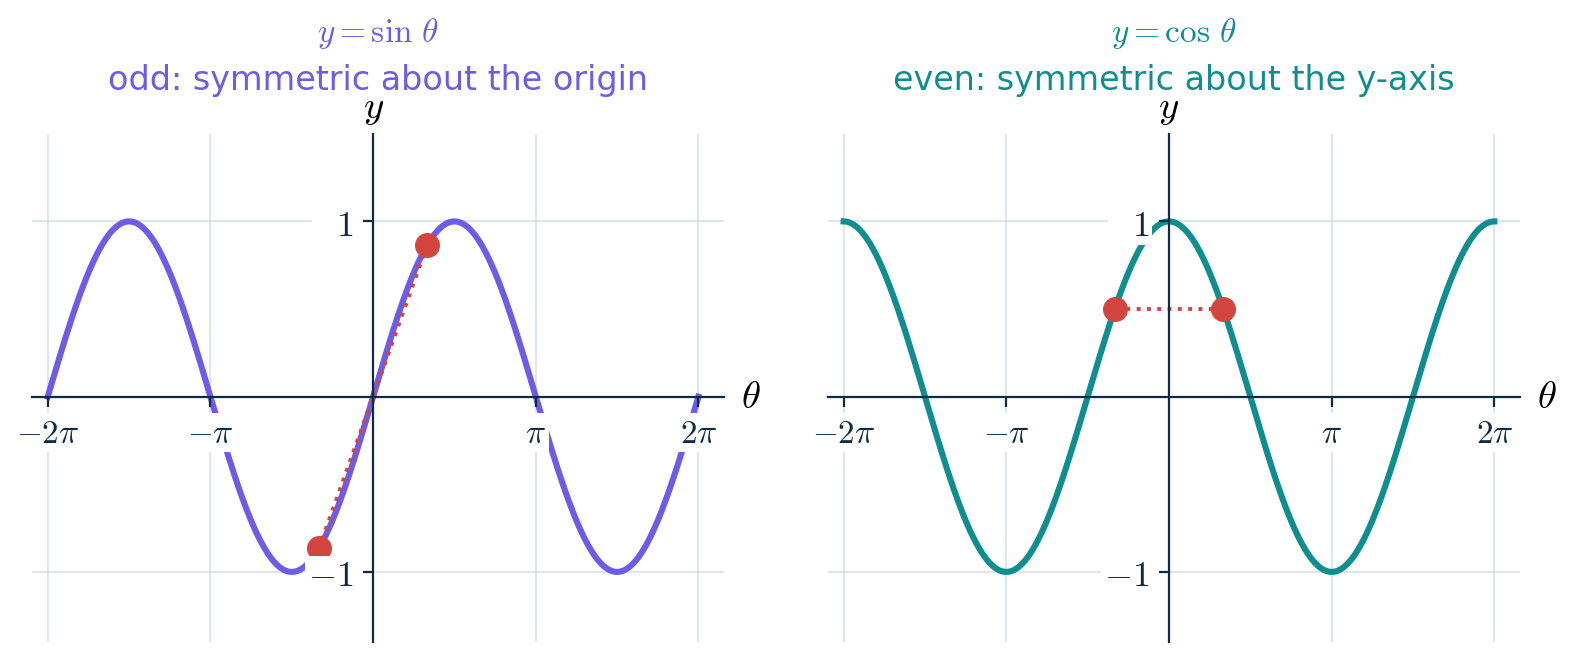
The red points are at and .
Four Measurements of a Sinusoid
CONCEPT
Period, frequency, amplitude, and midline
Period: the horizontal length of one complete cycle (from 3.1).
Frequency: the number of cycles completed per unit of input. It is the reciprocal of the period.
Amplitude: the vertical distance from the midline to a maximum (or to a minimum). It is half the distance from the minimum value to the maximum value.
Midline: the horizontal line halfway between the maximum and minimum values.
For and , the period is , the frequency is 1/() ≈ 0.159 cycles per radian, the amplitude is 1, and the midline is .
Worked example
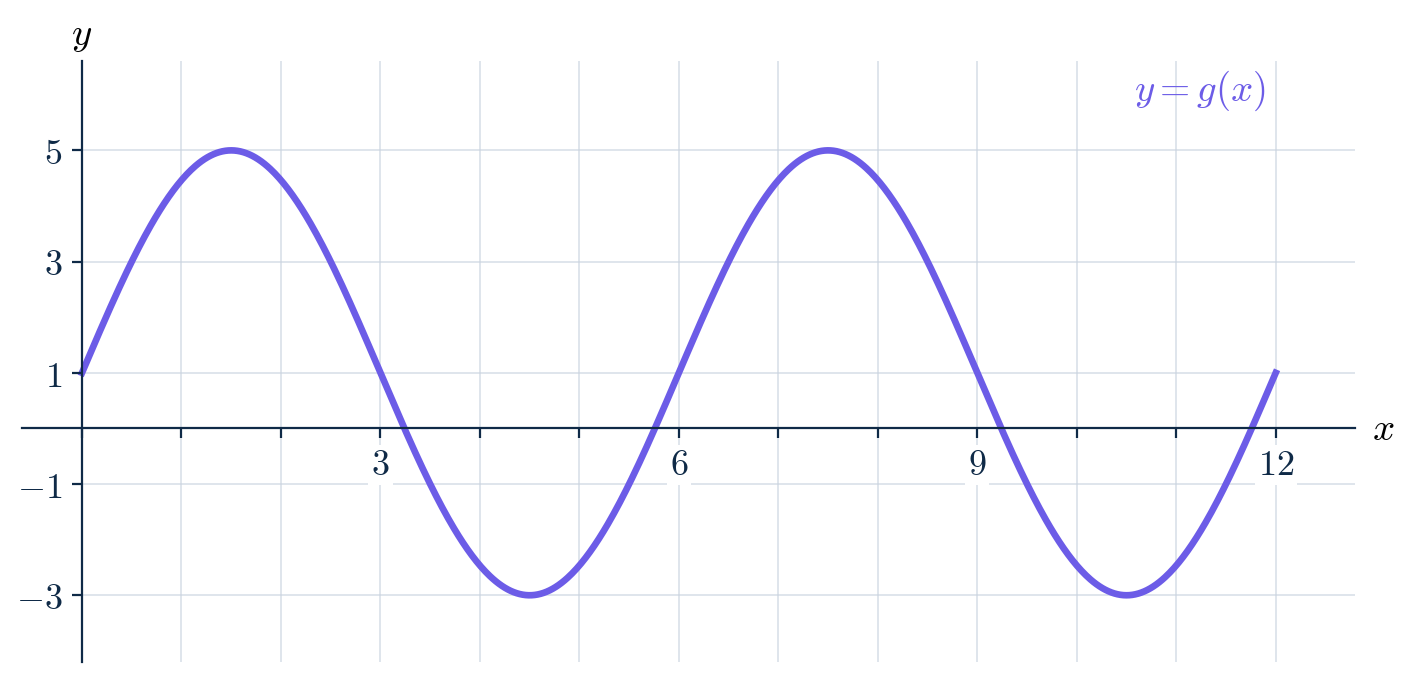
Example 1. The graph of a sinusoidal function is shown. Find the period, frequency, amplitude, and midline of .
- 01
Read the extreme values from the graph: the maximum value is 5 and the minimum value is −3.
- 02
Midline: , so the midline is .
- 03
Amplitude: . Check: from the midline 1 up to the maximum 5 is 4 units. ✓
- 04
Period: two consecutive maximums occur at and , so the period is . Check with the midline: the graph rises through at and next at . ✓
- 05
Frequency: . The graph completes one-sixth of a cycle per unit of .
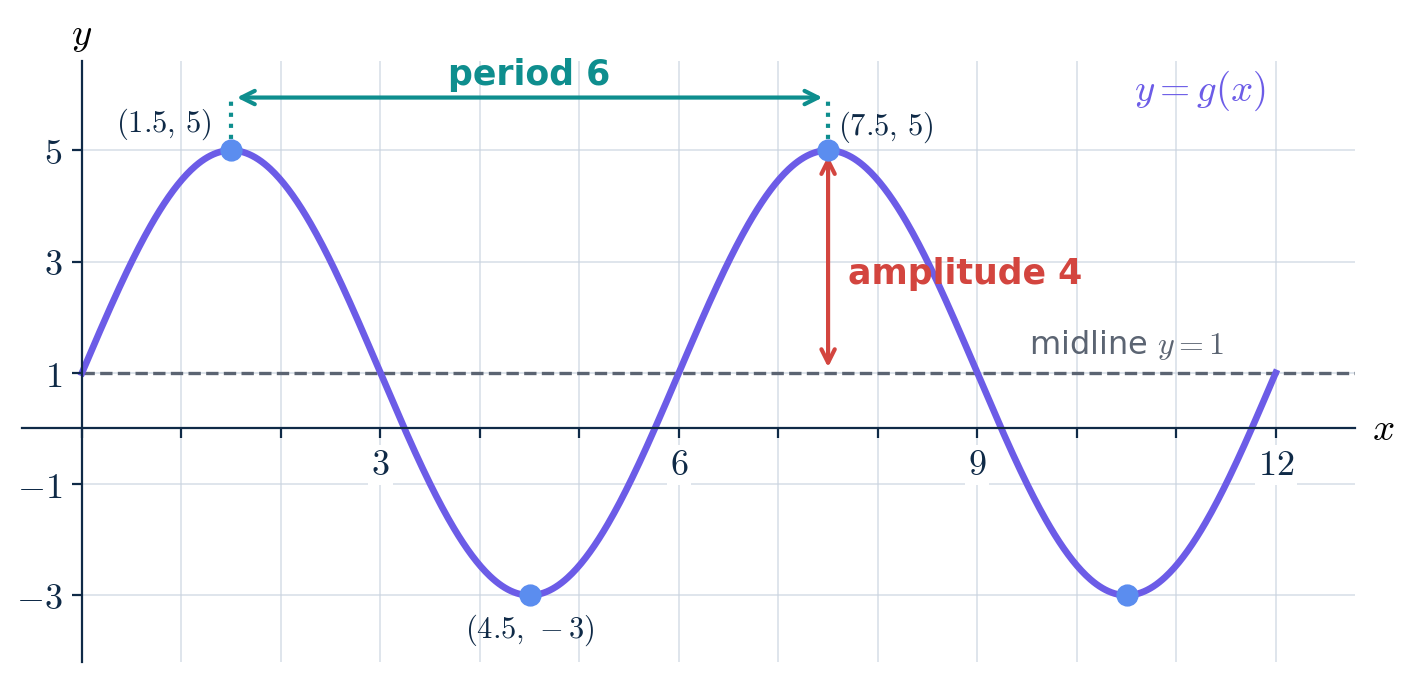
The four measurements of .
COMMON MISTAKE
"The amplitude is ."
max − min is the full height of the wave, from its lowest point to its highest. The amplitude is measured from the MIDDLE of the wave, so it is half of that: .
Quick check: midline + amplitude should give the maximum , and midline − amplitude should give the minimum .
Quick check
A sinusoid has maximum and minimum . What are its amplitude and midline?
Finding the Measurements from Two Points
Worked example
Example 2. A sinusoidal function has a minimum at the point . The next maximum after that occurs at the point . Find the period, frequency, amplitude, and midline of .
- 01
Midline: .
- 02
Amplitude: .
- 03
A minimum and the very next maximum are only half a cycle apart: the wave has climbed from its lowest point to its highest point, but it still has to come back down. So half the period is , and the period is .
- 04
Frequency: .
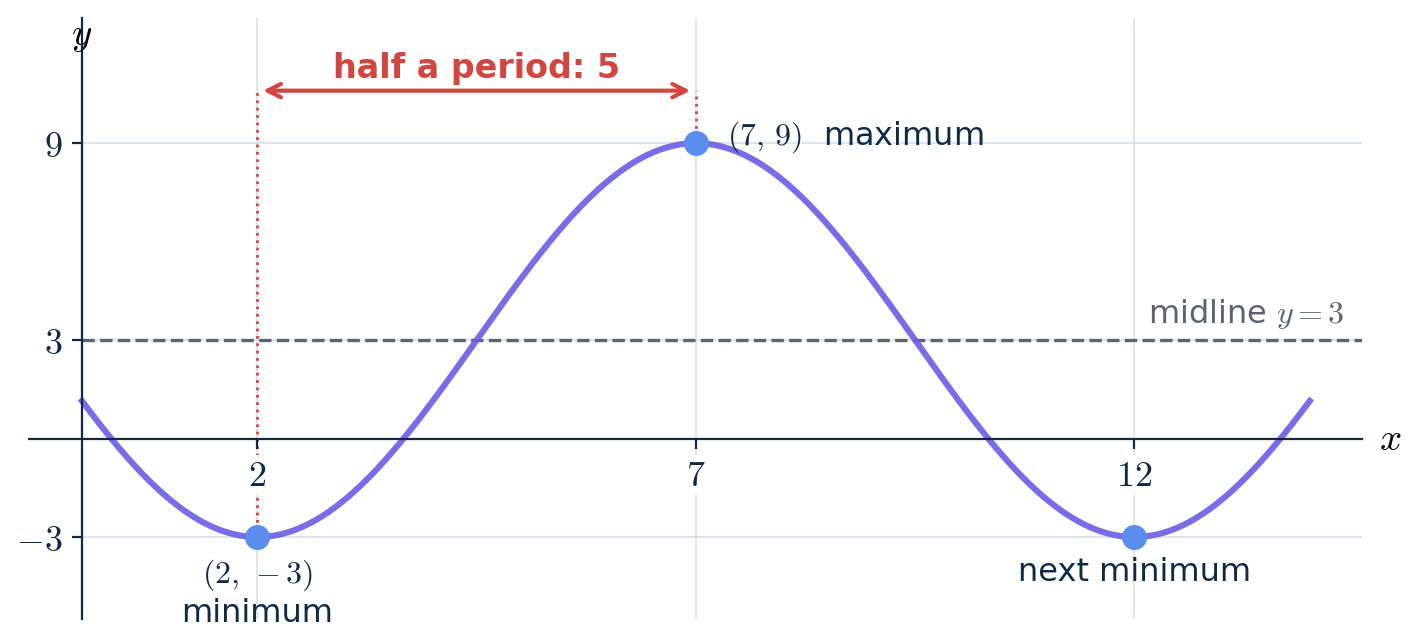
From a minimum to the next maximum is half of one cycle.
COMMON MISTAKE
"From the minimum at to the maximum at is 5, so the period is 5."
The period is the length of a complete cycle — the wave must return to where it started, doing the same thing (3.1). A minimum to the next maximum is only halfway. The next minimum is at , so the period is .
KEY RULE
Max to next max = 1 period. Max to next min = ½ period. Midline to next max or min = ¼ period.
Amplitude and Midline from an Equation
The simplest transformations change only the height of the wave. Multiplying or by a constant a stretches the graph vertically, and adding a constant slides it up or down.
CONCEPT
and
Amplitude: . If a is negative, the graph is also reflected over its midline.
Midline: .
Maximum value: . Minimum value: .
The period is still , because nothing has changed the input . Changing the period is the job of 3.6.
Worked example
Example 3. For , find the amplitude, midline, maximum value, minimum value, period, and frequency.
- 01
, so the amplitude is . The negative sign flips the graph over its midline; it does not make the amplitude negative.
- 02
, so the midline is .
- 03
Maximum value: . Minimum value: .
- 04
The input is just , so the period is still and the frequency is 1/() ≈ 0.159.
- 05
Because of the reflection, this graph goes DOWN first. Where has its maximum , this graph has its minimum, 2.5; its maximum, 5.5, is at .
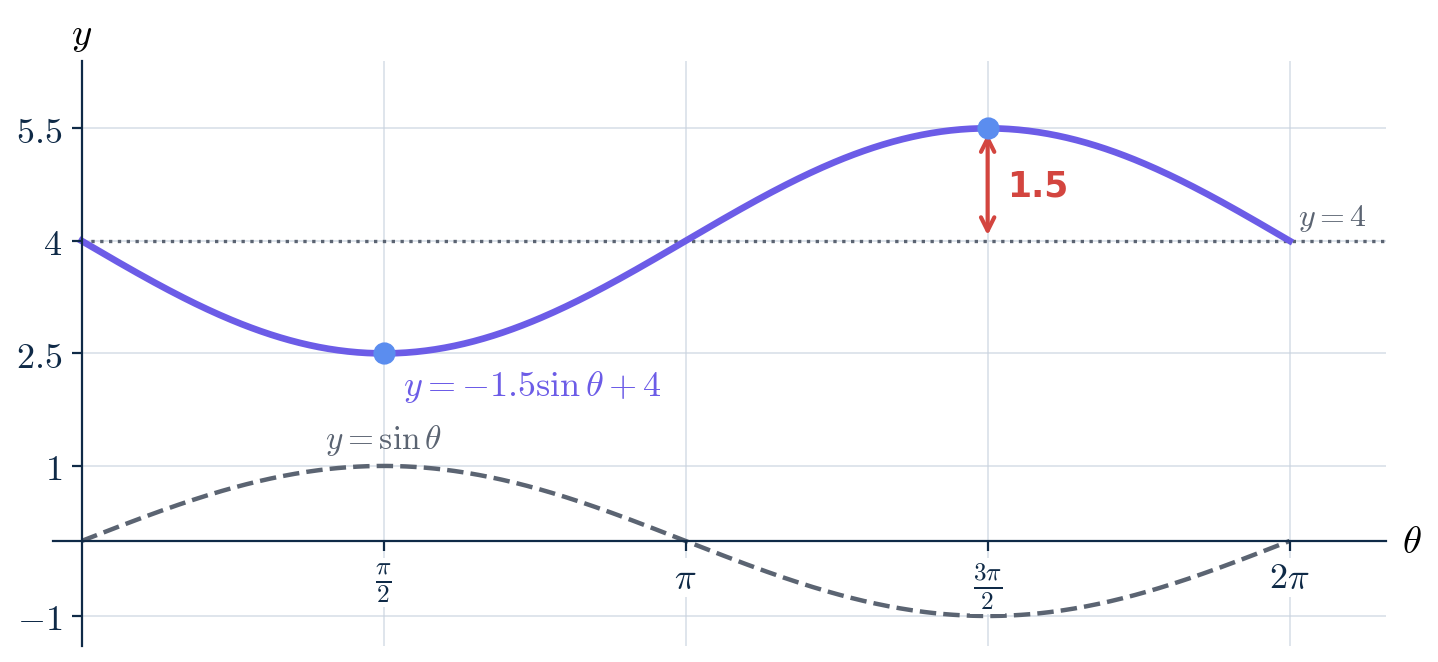
compared with : stretched by 1.5, flipped, and lifted to the midline .
COMMON MISTAKE
"The amplitude of is −1.5."
Amplitude is a distance, so it is never negative. The sign of a tells you which way the wave starts (up or down); tells you how far it swings.
Watch the maximum, too: is actually the MINIMUM. Use for the maximum and for the minimum.
REAL-LIFE EXAMPLE
The pedal, measured
Back to the pedal from 3.1: its height ranged from 11 cm to 45 cm, and one turn took 1.2 seconds.
Midline: cm — the height of the crank's center.
Amplitude: cm — the length of the crank arm.
Period: 1.2 seconds. Frequency: turns per second.
Every measurement has a physical meaning. That is the power of describing periodic data with a sinusoid.
Quick check
For , what are the maximum and minimum values?
Common slips
"The amplitude is ."
max − min is the full height of the wave, from its lowest point to its highest. The amplitude is measured from the middle of the wave, so it is half of that: .
Quick check: midline + amplitude should give the maximum , and midline − amplitude should give the minimum .
"From the minimum at to the maximum at is 5, so the period is 5."
The period is the length of a complete cycle — the wave must return to where it started, doing the same thing (3.1). A minimum to the next maximum is only halfway. The next minimum is at , so the period is .
"The amplitude of is −1.5."
Amplitude is a distance, so it is never negative. The sign of a tells you which way the wave starts (up or down); tells you how far it swings.
Watch the maximum, too: is actually the minimum. Use for the maximum and for the minimum.
Lock it in
Try the flashcards
21 cards · Sinusoids, Sine or cosine graph?, Where is it rising or bending?
Recap card
6 lines to re-read the night before.
- 01
A sinusoidal function is built from by additive and multiplicative transformations. , so cosine is sinusoidal.
- 02
Sine is odd (symmetric about the origin); cosine is even (symmetric about the y-axis).
- 03
Amplitude = (max − min) ÷ 2. Midline: y = (max + min) ÷ 2. Frequency = 1 ÷ period.
- 04
Max to next max is a full period; max to next min is half a period; midline to the next extreme is a quarter period.
- 05
For or : amplitude , midline , max , min , period .
- 06
Coming up in 3.6: changing the period and sliding the graph horizontally.