
Topic 3.4
Sine and Cosine Function Graphs
In 3.3 we found that a pedal on a rotating crank has height . To understand motion like that, we need to see how itself behaves as changes. In this note we turn the unit circle into two graphs, and . Everything about these graphs — their shape, their range, and why they repeat — comes straight from a point moving around the circle.
9 MIN READ6 IDEAS33 PROBLEMS21 flashcards
Read this first
30 sec
- 01
Every quarter turn gives a key point: a zero, a maximum, or a minimum.
- 02
Sine and cosine always bend toward the midline: concave down above it, concave up below it.
From the Unit Circle to the Sine Graph
Picture a point traveling counterclockwise around the unit circle. Its angle keeps growing, and its height — its y-coordinate — is . If we record the height for each angle and plot the pairs , with on the horizontal axis, we get the graph of the sine function. The values from 3.3 give us the first half-turn:
| θ | 0 | π/6 | π/3 | π/2 | 2π/3 | 5π/6 | π |
|---|---|---|---|---|---|---|---|
| sin θ (exact) | 0 | 1/2 | √3/2 | 1 | √3/2 | 1/2 | 0 |
| sin θ (decimal) | 0 | 0.5 | 0.866 | 1 | 0.866 | 0.5 | 0 |
From to the point is below the x-axis. By the reflection rule from 3.2B, each height there is the negative of the height half a turn earlier: . So the second half-turn is the first half-turn with the signs flipped.
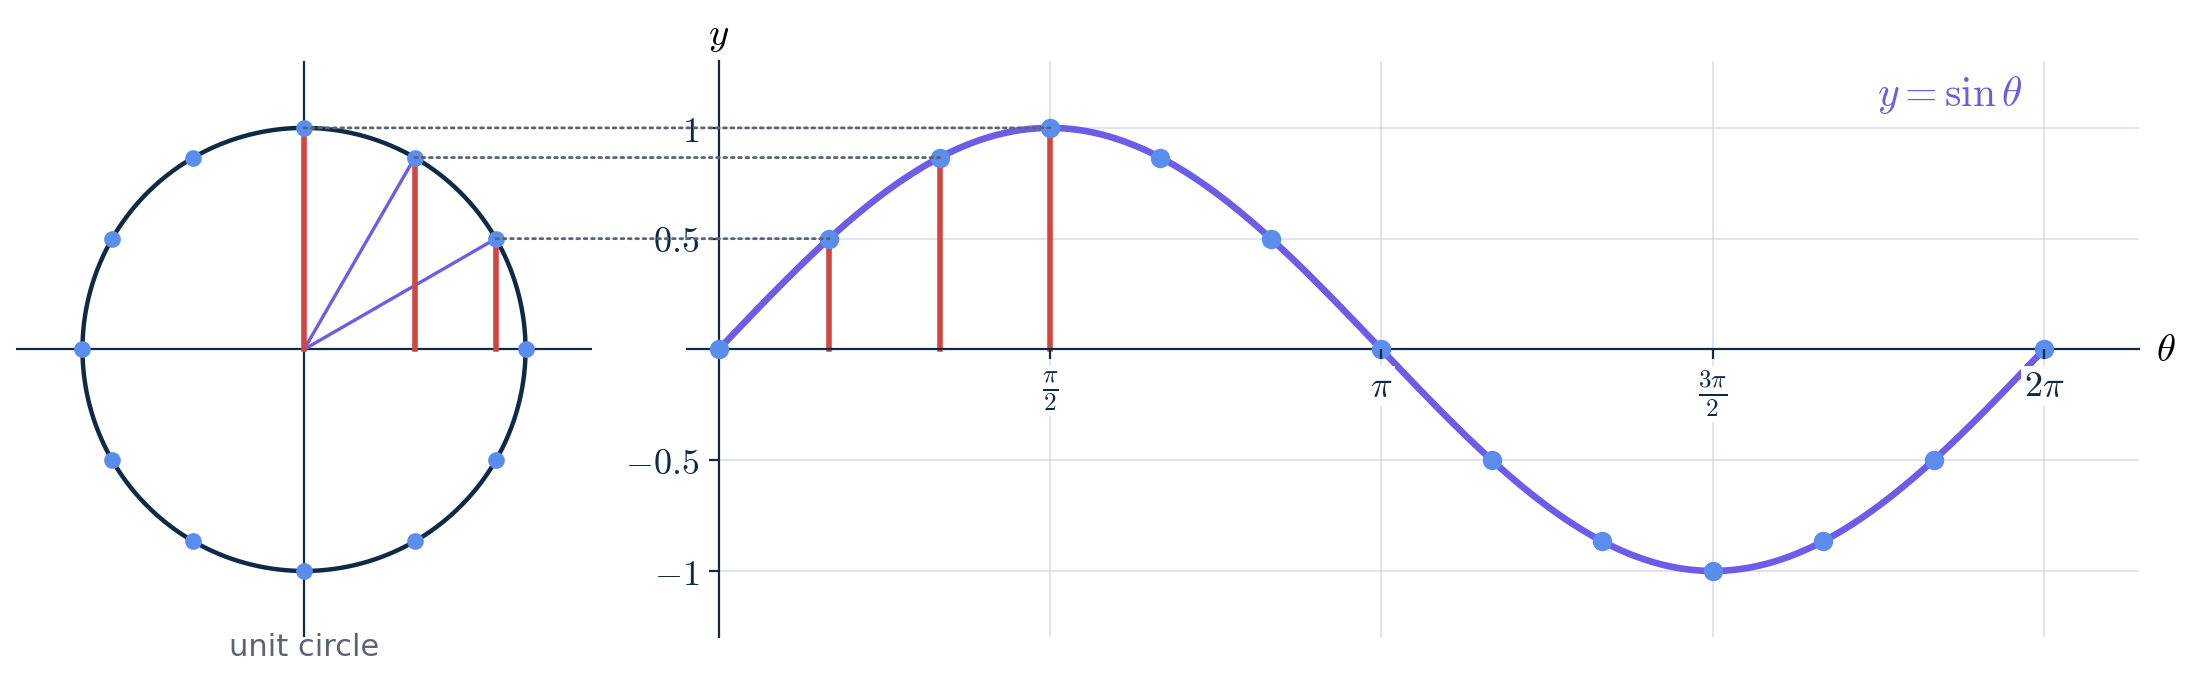
Each height on the unit circle (red) becomes a height on the graph. The dotted lines are exactly horizontal.
Read the graph as the story of the moving point. It starts at height 0, climbs to its highest point, 1, at the top of the circle , comes back down to 0 on the left (), sinks to its lowest point, −1, at the bottom , and returns to 0 when it completes the turn ().
The Cosine Graph
Cosine records the other coordinate: is the horizontal position of the point. The point starts all the way to the right (), passes at the top of the circle, reaches on the left, returns to at the bottom, and ends back at .
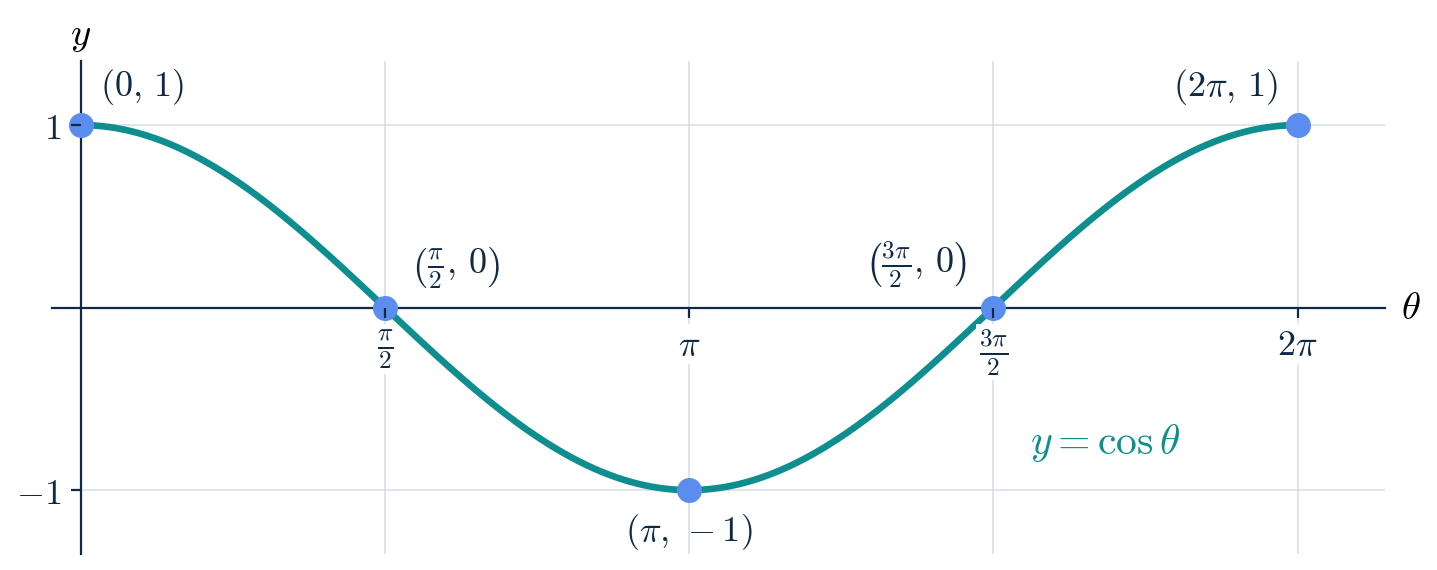
One cycle of . A key point occurs every quarter turn.
| θ | 0 | π/2 | π | 3π/2 | 2π |
|---|---|---|---|---|---|
| sin θ | 0 | 1 | 0 | −1 | 0 |
| cos θ | 1 | 0 | −1 | 0 | 1 |
KEY RULE
Every quarter turn gives a key point: a zero, a maximum, or a minimum.
COMMON MISTAKE
"The cosine graph starts at 0, just like the sine graph."
At the point is at , on the far right of the circle. Its height is 0, so — but its horizontal position is 1, so .
If you forget which graph starts where, draw the point for on the unit circle and read its two coordinates.
Domain, Range, and Period
Any real number can be an angle — positive, negative, or many turns long — so both functions are defined for every real . And because the point never leaves the unit circle, its coordinates never leave the interval from −1 to 1.
CONCEPT
Basic features of and
Domain: all real numbers.
Range: .
Period: . Remember from 3.2A that adding to an angle gives the same terminal ray, so and .
Each graph is one cycle of length , repeated forever in both directions.
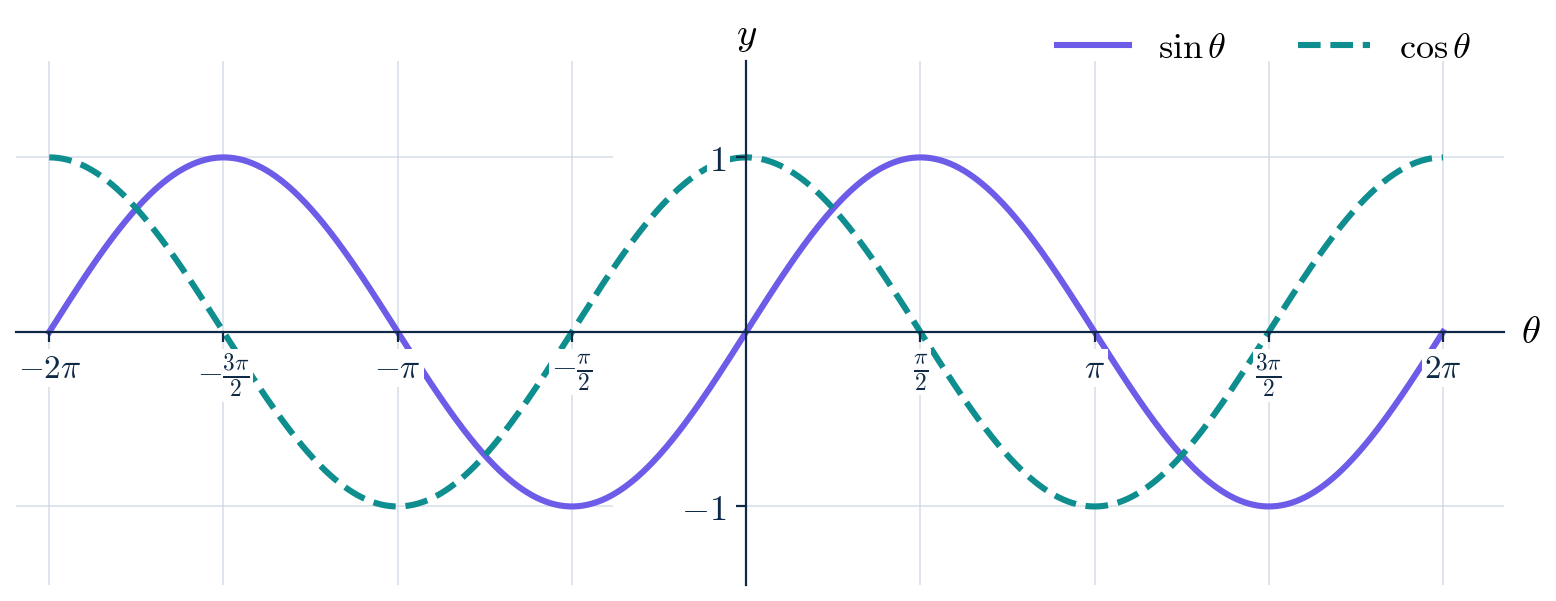
Both graphs over two full periods. Every , each pattern starts over.
Notice that the two graphs have exactly the same shape: the cosine graph is the sine graph slid to the left. We will make that precise in 3.5.
Quick check
What are the range and the period of ?
Increasing, Decreasing, and Concavity
Remember from 3.1: whatever a periodic function does in one cycle, it does in every cycle. So we only need to describe and on one period, from 0 to .
| Interval | (0, π/2) | (π/2, π) | (π, 3π/2) | (3π/2, 2π) |
|---|---|---|---|---|
| sin θ | increasing, concave down | decreasing, concave down | decreasing, concave up | increasing, concave up |
| cos θ | decreasing, concave down | decreasing, concave up | increasing, concave up | increasing, concave down |
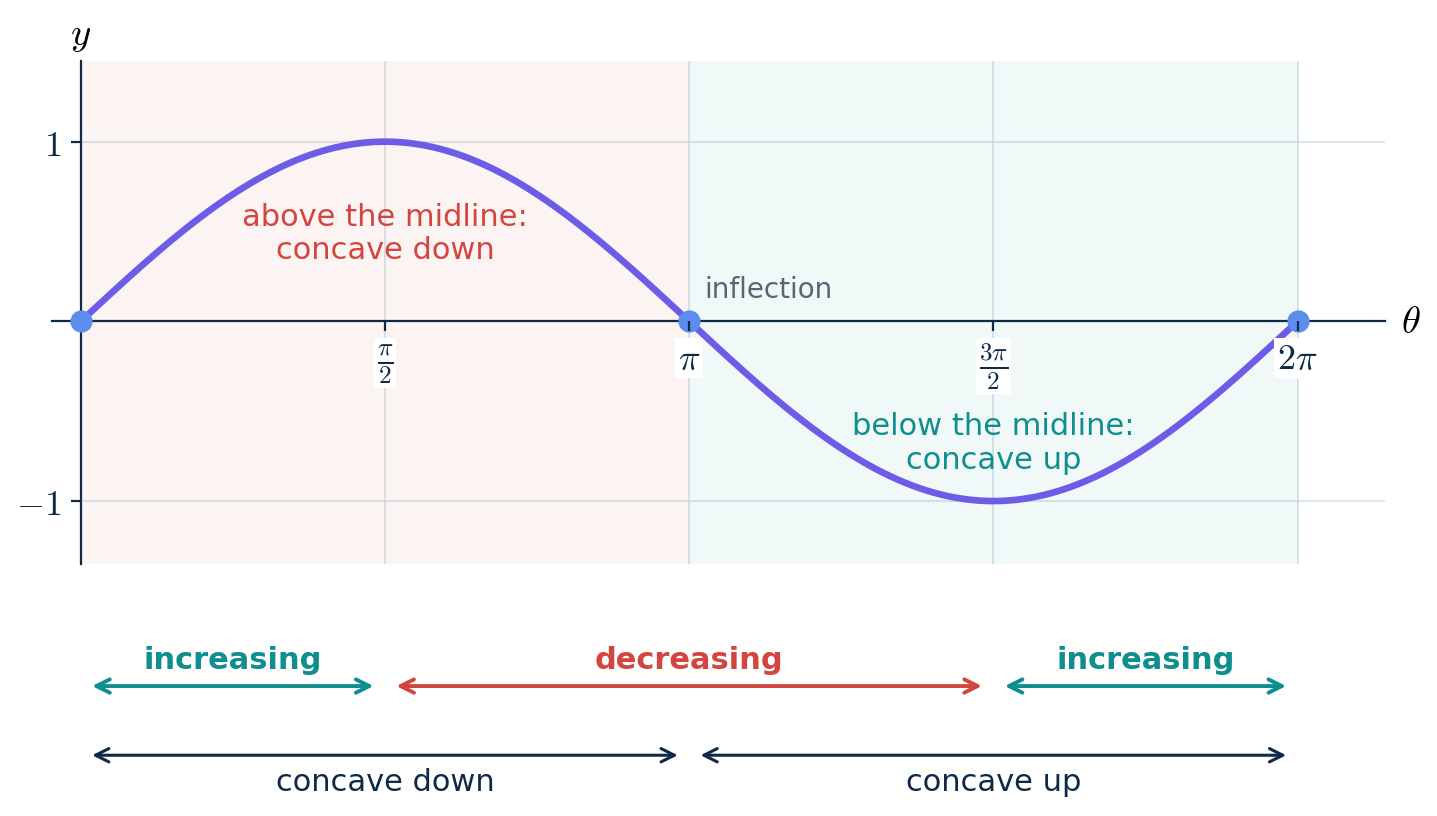
One period of , with its increasing/decreasing intervals and concavity.
There is a simple pattern hiding in the concavity. Both graphs bend toward the midline : above the midline they are concave down, below it they are concave up, and the inflection points are exactly where the graph crosses the midline.
KEY RULE
Sine and cosine always bend toward the midline: concave down above it, concave up below it.
Why does this happen? Think about the moving point. Near the top of the circle it moves almost sideways, so its height barely changes — the graph flattens out. At the far right and far left of the circle it moves almost straight up or down, so its height changes fastest. That is why the sine graph is steepest where it crosses the midline and flattest at its maximum and minimum.
Worked example
Example 1. Decide whether each function is increasing or decreasing on the interval, and describe its concavity. on on on
- 01
(a) From to the point moves from the left of the circle to the bottom, so its height falls from 0 to −1: is decreasing. The graph is below the midline, so it is concave up.
- 02
(b) From to the point moves from the bottom to the far right, so its horizontal position grows from 0 to 1: is increasing. The graph is above the midline, so it is concave down.
- 03
(c) This interval is outside 0 to , so first subtract whole periods: and . On , falls from 1 to 0 while staying above the midline: decreasing and concave down.
COMMON MISTAKE
" is positive on , so it is increasing on ."
Positive and increasing are different questions. Positive asks whether the graph is above the θ-axis; increasing asks whether the graph is going up. On , is still positive, but it is going down — the point has already passed the top of the circle.
Check with two values: and are both positive, but the later one is smaller.
Comparing Values Without a Calculator
Knowing where each graph rises and falls lets us compare values quickly, even for inputs that are not special angles.
Worked example
Example 2. Without a calculator, decide which value is greater. or or
- 01
(a) Locate the inputs: and , so both 2 and 2.5 lie in . On that interval is decreasing, so the larger input gives the smaller output: .
- 02
, , and , so 4 lies in and 5 lies in . Cosine is increasing on the whole interval , so .
- 03
Check with a calculator in radian mode: and ; and . ✓
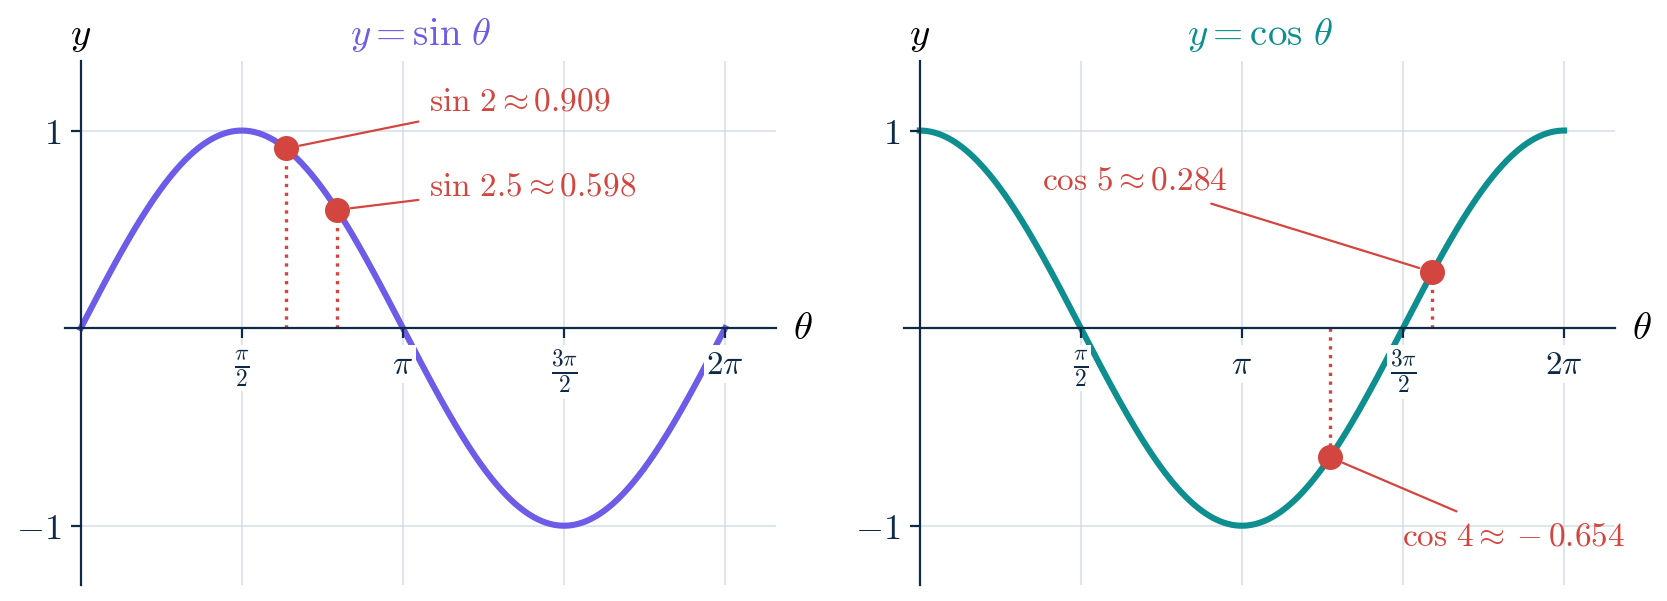
Left: sine is decreasing on . Right: cosine is increasing on .
COMMON MISTAKE
", so ."
That reasoning works only on an interval where is increasing. A function that goes up and down does not keep inputs and outputs in the same order everywhere.
Before comparing, always find which interval each input lies in and what the function is doing there.
REAL-LIFE EXAMPLE
The pedal graph was a cosine graph all along
Look back at the pedal height graph from 3.1. It started at its lowest point, rose to its highest point, and returned — and it bent toward its middle height of 28 cm: concave up below 28 cm, concave down above it.
That is exactly the pattern of , turned upside down, stretched vertically, lifted up, and squeezed so that one cycle takes 1.2 seconds instead of .
Topics 3.5 and 3.6 show how each of those changes appears in the equation.
Quick check
Without a calculator, which is larger: or ?
Common slips
"The cosine graph starts at 0, just like the sine graph."
At the point is at , on the far right of the circle. Its height is 0, so — but its horizontal position is 1, so .
If you forget which graph starts where, draw the point for on the unit circle and read its two coordinates.
" is positive on , so it is increasing on ."
Positive and increasing are different questions. Positive asks whether the graph is above the θ-axis; increasing asks whether the graph is going up. On , is still positive, but it is going down — the point has already passed the top of the circle.
Check with two values: and are both positive, but the later one is smaller.
", so ."
That reasoning works only on an interval where is increasing. A function that goes up and down does not keep inputs and outputs in the same order everywhere.
Before comparing, always find which interval each input lies in and what the function is doing there.
Lock it in
Try the flashcards
21 cards · Sinusoids, Sine or cosine graph?, Where is it rising or bending?
Recap card
6 lines to re-read the night before.
- 01
The graph of plots the height of a point moving around the unit circle; plots its horizontal position.
- 02
Key points occur every quarter turn. : 0, 1, 0, −1, 0. : 1, 0, −1, 0, 1.
- 03
Domain: all real numbers. Range: . Period: .
- 04
Both graphs bend toward the midline: concave down above it, concave up below it, with inflection points on the midline.
- 05
Positive does not mean increasing — check the interval.
- 06
To compare values, find the interval each input lies in and use whether the function is increasing or decreasing there.