
Topic 3.14B
Polar Function Graphs
Part A covered circles and roses. Part B covers one more family, the limaçons, and gives you two easy tools that work on ANY polar graph: the four-point sketch and the rectangular graph of .
9 MIN READ4 IDEAS43 PROBLEMS13 flashcards
Read this first
30 sec
- 01
→ the curve passes through the pole. → the point is on the opposite side.
Limaçons
A limaçon (say "LEE-ma-son") is a constant plus a sinusoid. There are four shapes, and which one you get depends only on the SIZES of and (take ):
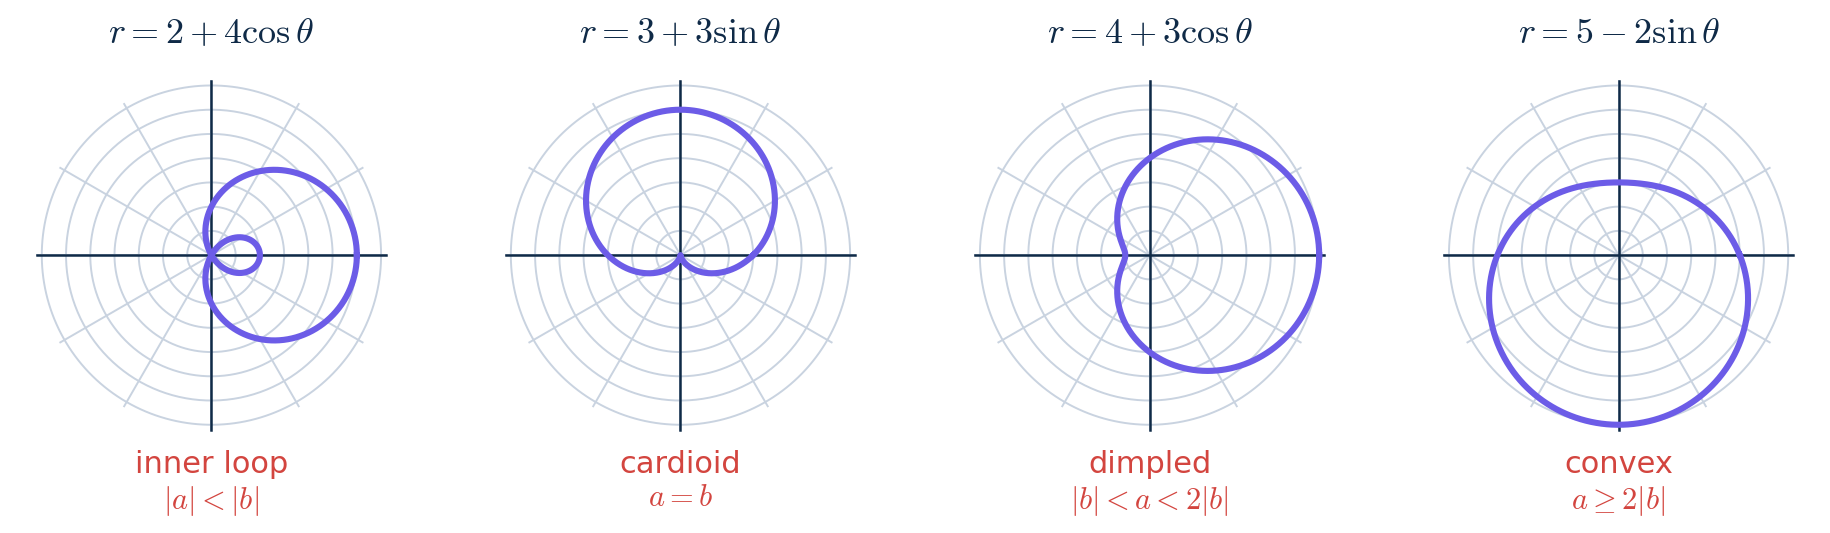
The four kinds of limaçon.
CONCEPT
Classify in one step: compare a with
→ inner loop ( becomes negative for a while).
→ cardioid, a heart shape ( just touches 0 once).
→ dimpled (a dent, but no loop).
→ convex (round, no dent).
Then find the direction: versions point left/right, versions point up/down. The widest part is where .
| Example | Compare | Type | Largest r and where |
|---|---|---|---|
| r = 2 + 4 cos θ | 2 < 4 | inner loop | 6, at θ = 0 (right) |
| r = 3 + 3 sin θ | 3 = 3 | cardioid | 6, at θ = π/2 (up) |
| r = 4 + 3 cos θ | 3 < 4 < 6 | dimpled | 7, at θ = 0 (right) |
| r = 5 − 2 sin θ | 5 ≥ 4 | convex | 7, at θ = 3π/2 (down) |
COMMON MISTAKE
Deciding the type from the SIGN of , so that is called something different from .
The type depends only on the sizes a and . The sign of only decides which way the curve points: is widest upward, is widest downward. Both are convex because .
CONCEPT
Try it yourself
Classify each limaçon and say which way it is widest.
- . . .
Answers: 1. Inner loop (), widest up. 2. Cardioid (), widest LEFT, because at . 3. Dimpled (), widest up. 4. Convex (), widest right.
Quick check
Classify .
The Four-Point Sketch
You do not need a big table to sketch a limaçon. Four points — one in each direction — are enough to get the shape.
CONCEPT
Four-point sketch
-
Find at , , , and (right, up, left, down).
-
Plot them. If an is negative, the point goes on the OPPOSITE side.
-
If somewhere, the curve passes through the pole there.
-
Connect smoothly, going around counterclockwise in the order of .
If you want more accuracy, use eight angles instead of four — every . Here is :
| θ | 0 | π/4 | π/2 | 3π/4 | π | 5π/4 | 3π/2 | 7π/4 |
|---|---|---|---|---|---|---|---|---|
| r | 7 | 6.12 | 4 | 1.88 | 1 | 1.88 | 4 | 6.12 |
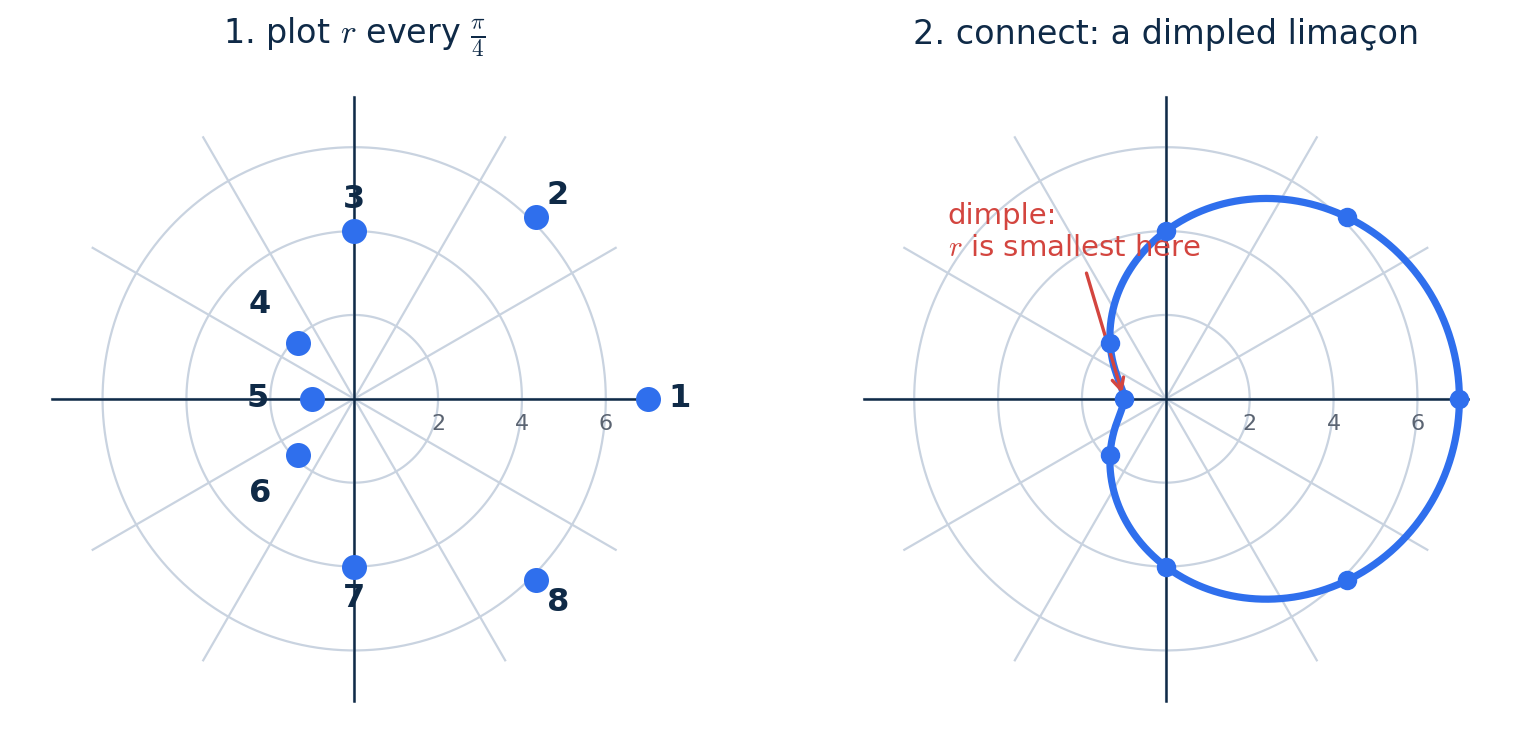
Eight points, numbered in order of , then connected.
Reading the table tells you the shape before you draw anything. starts at its largest, 7, shrinks to its smallest, 1, at , and grows back. Because the smallest is 1 — small, but still positive — the curve squeezes in close to the pole on the left without touching it. That squeeze is the DIMPLE. If the smallest had been 0 you would get a cardioid, and if it had been negative you would get an inner loop.
Worked example
Example 1. Sketch and .
- 01
: , , , . It starts AT the pole, goes up to 3, left to 6, down to 3, and back. Since , it is a cardioid, widest on the left.
- 02
: , , , . The value is negative: facing left and walking backward lands at , on the RIGHT, inside the big loop.
- 03
Where does pass through the pole? Solve : , so and (3.10A). Between these angles , and the curve draws the small inner loop.
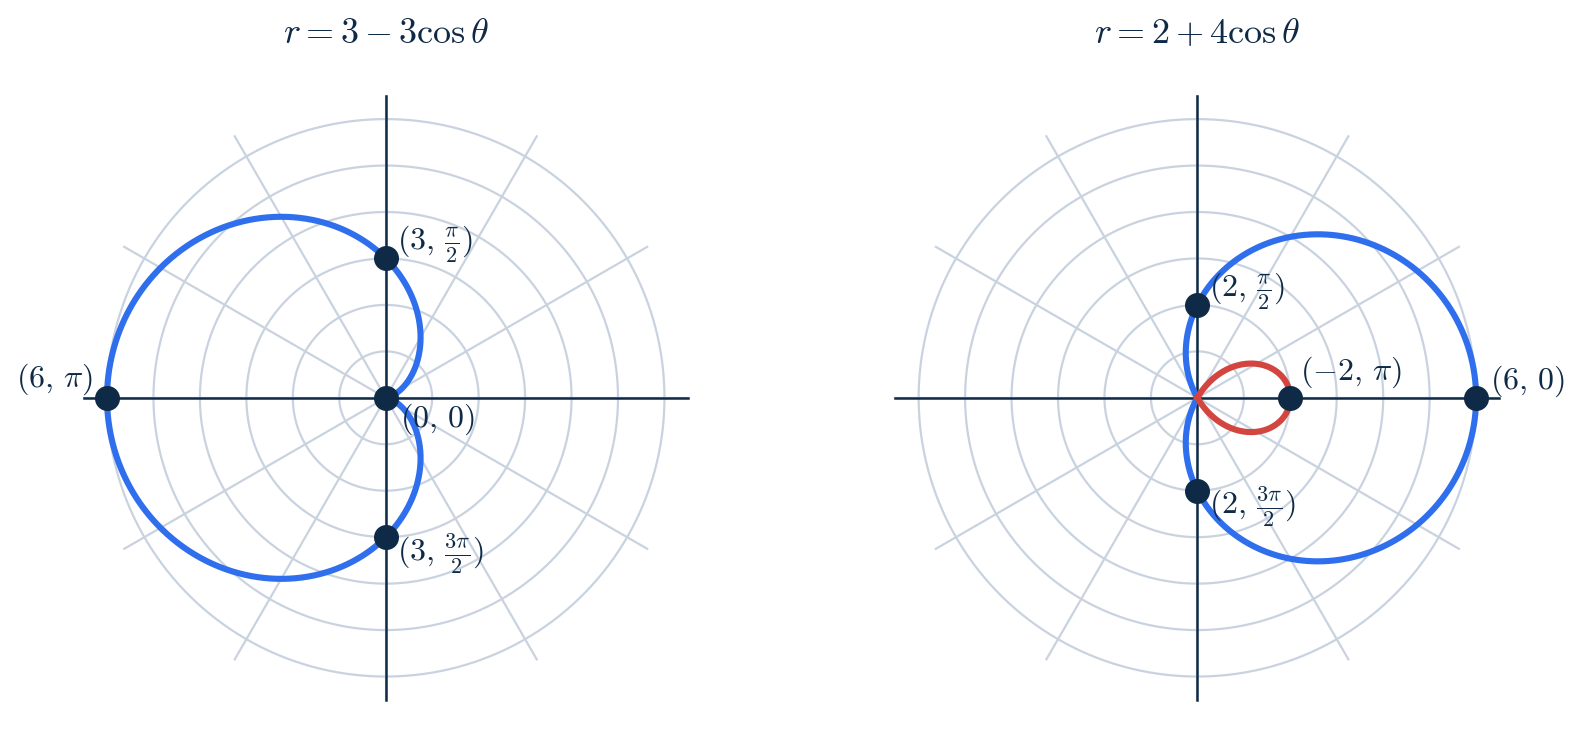
The four key points (dark dots). Blue: . Red: — the inner loop.
The inner loop of deserves a slow walk-through, because it is where most mistakes happen. Follow the three stages below, one θ-interval at a time.
θ-interval what r does what the point does 0 → 2π/3 falls from 6 to 0 starts far right, swings counterclockwise, arrives at the pole 2π/3 → π falls from 0 to −2 leaves the pole on the OPPOSITE side, moving right to (2, 0) π → 4π/3 rises from −2 to 0 comes back to the pole (still on the opposite side) 4π/3 → 2π rises from 0 to 6 draws the rest of the outer curve and closes it 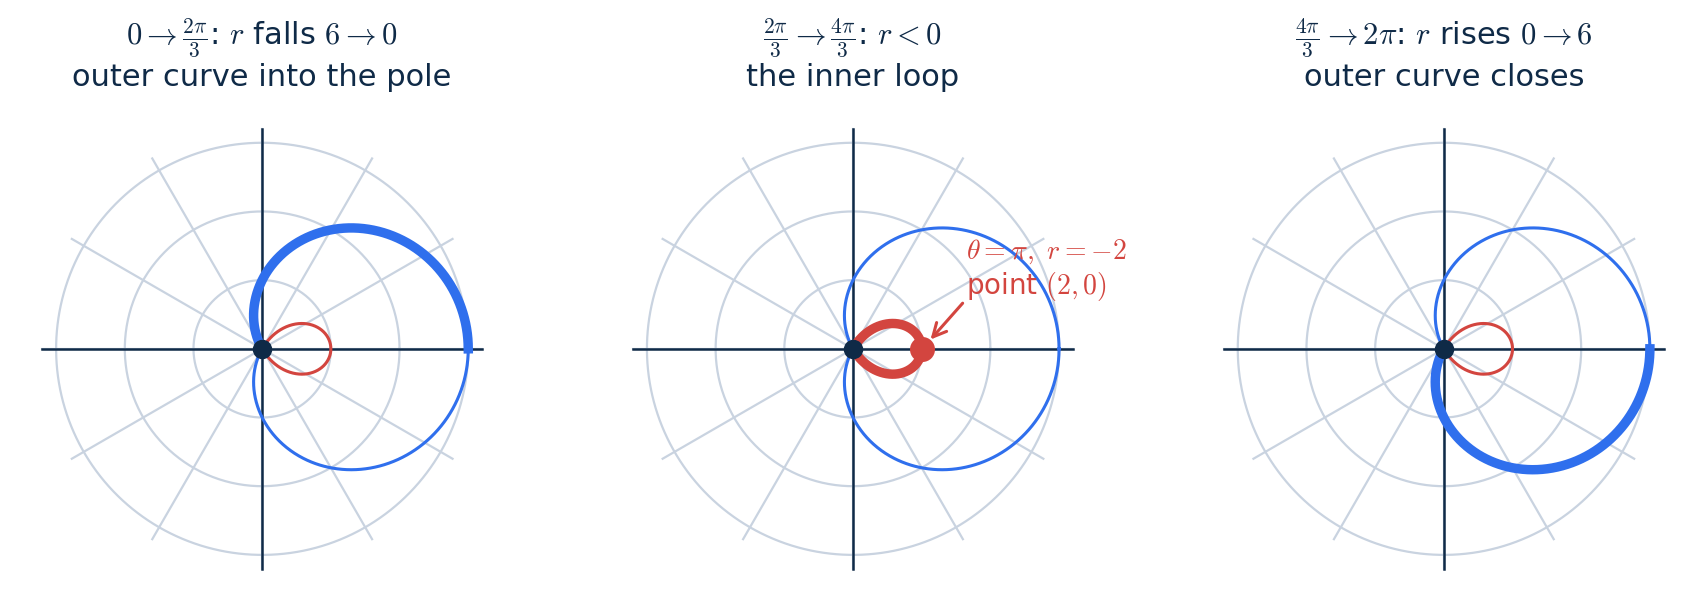
Three stages. The middle picture is the whole inner loop: it is drawn entirely while is negative.
Notice that the inner loop is traced on the RIGHT even though those angles (between and ) all point to the left. That is the whole story of a negative .
Quick check
For , at which in does the curve pass through the pole?
From the Rectangular Graph to the Polar Graph
KEY RULE
→ the curve passes through the pole. → the point is on the opposite side.
Worked example
Example 2. Use the rectangular graph of to sketch its polar graph for , and explain where the inner loop comes from.
- 01
Zeros: → → and (3.10A, Example 1). The curve passes through the pole at these angles.
- 02
Split the θ-axis at the key angles. A (0 to ): grows from 1 to 3, moving away. B ( to ): shrinks from 3 to 0, coming back to the pole.
- 03
( to ): is NEGATIVE, lowest value −1 at . Facing down and walking backward 1 unit puts the point at , ABOVE the pole. All of segment lands on the opposite side and forms the inner loop.
- 04
( to ): grows from 0 back to 1, closing the curve at . Type check: , inner loop ✓.
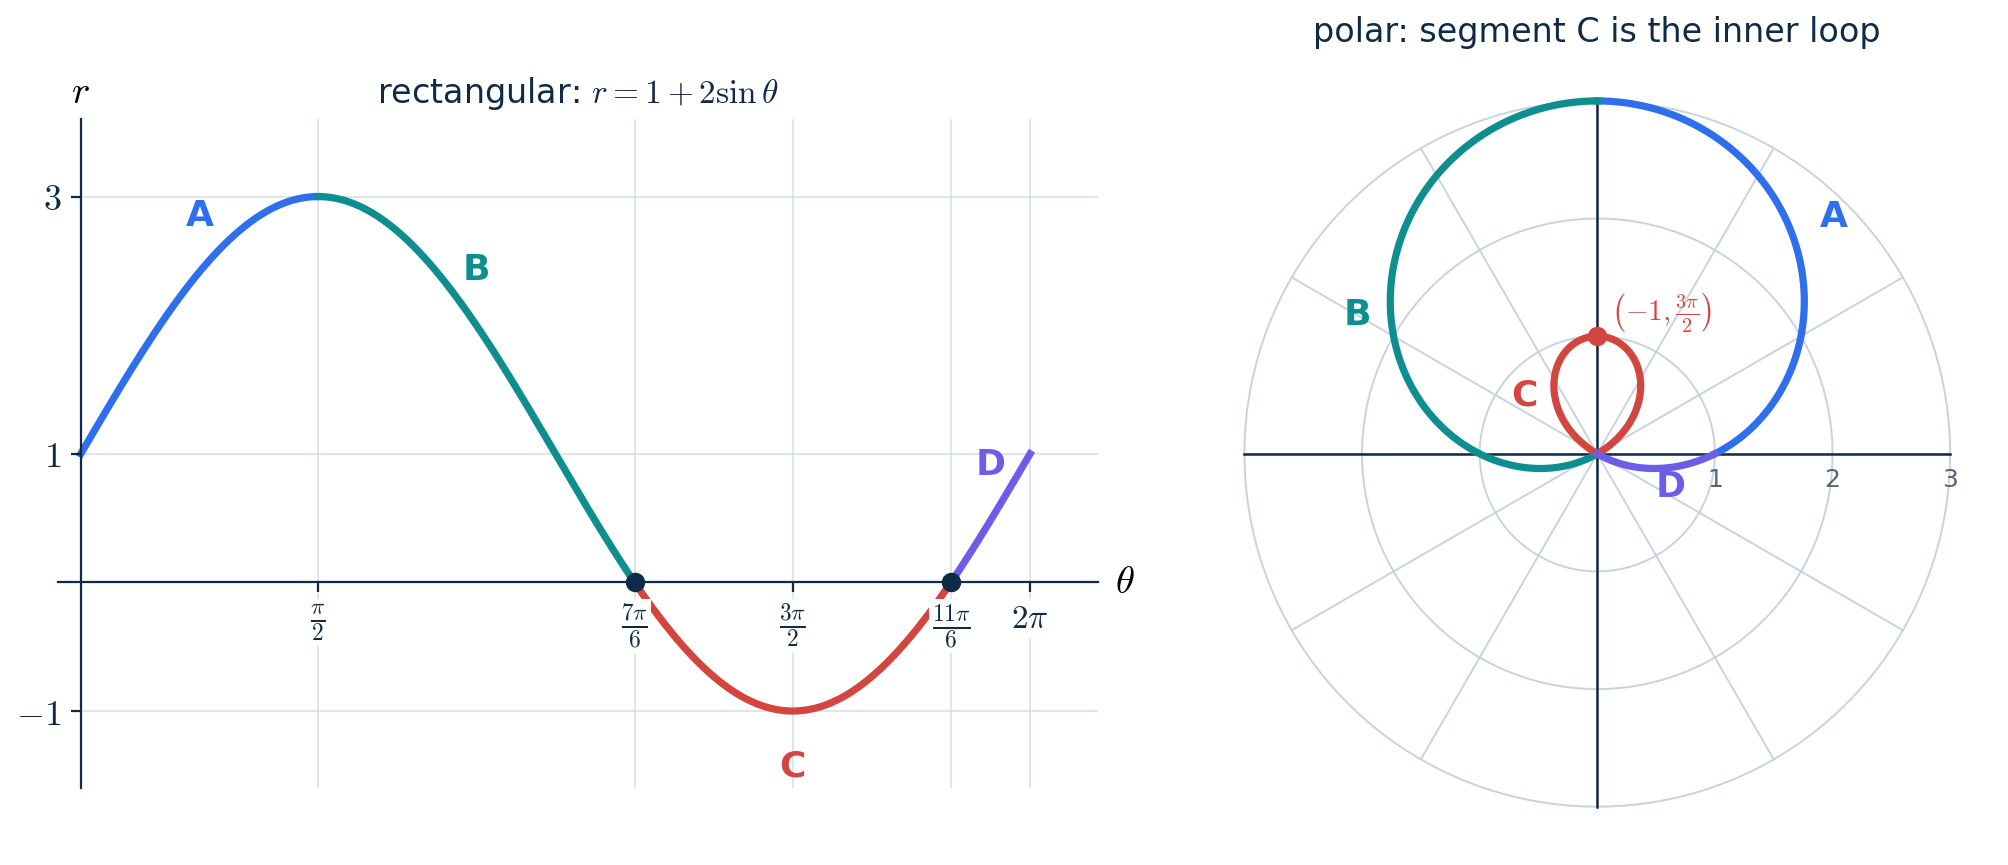
Matching colors: the negative part of the rectangular graph becomes the inner loop of the polar graph.
COMMON MISTAKE
Reading the lowest point of the rectangular graph, at , as "the curve is 1 unit below the pole."
The rectangular graph shows , not height. at means face down and walk backward, which is 1 unit UP. The lowest point of the rectangular graph becomes the TOP of the inner loop.
Worked example
Example 3. Now flip the sign: sketch . Where is its inner loop?
- 01
Zeros: → → and .
- 02
Between and , , so . The lowest value is : facing UP and walking backward puts the point at , BELOW the pole.
- 03
So this time the inner loop hangs below the pole, and the big loop is widest downward: .
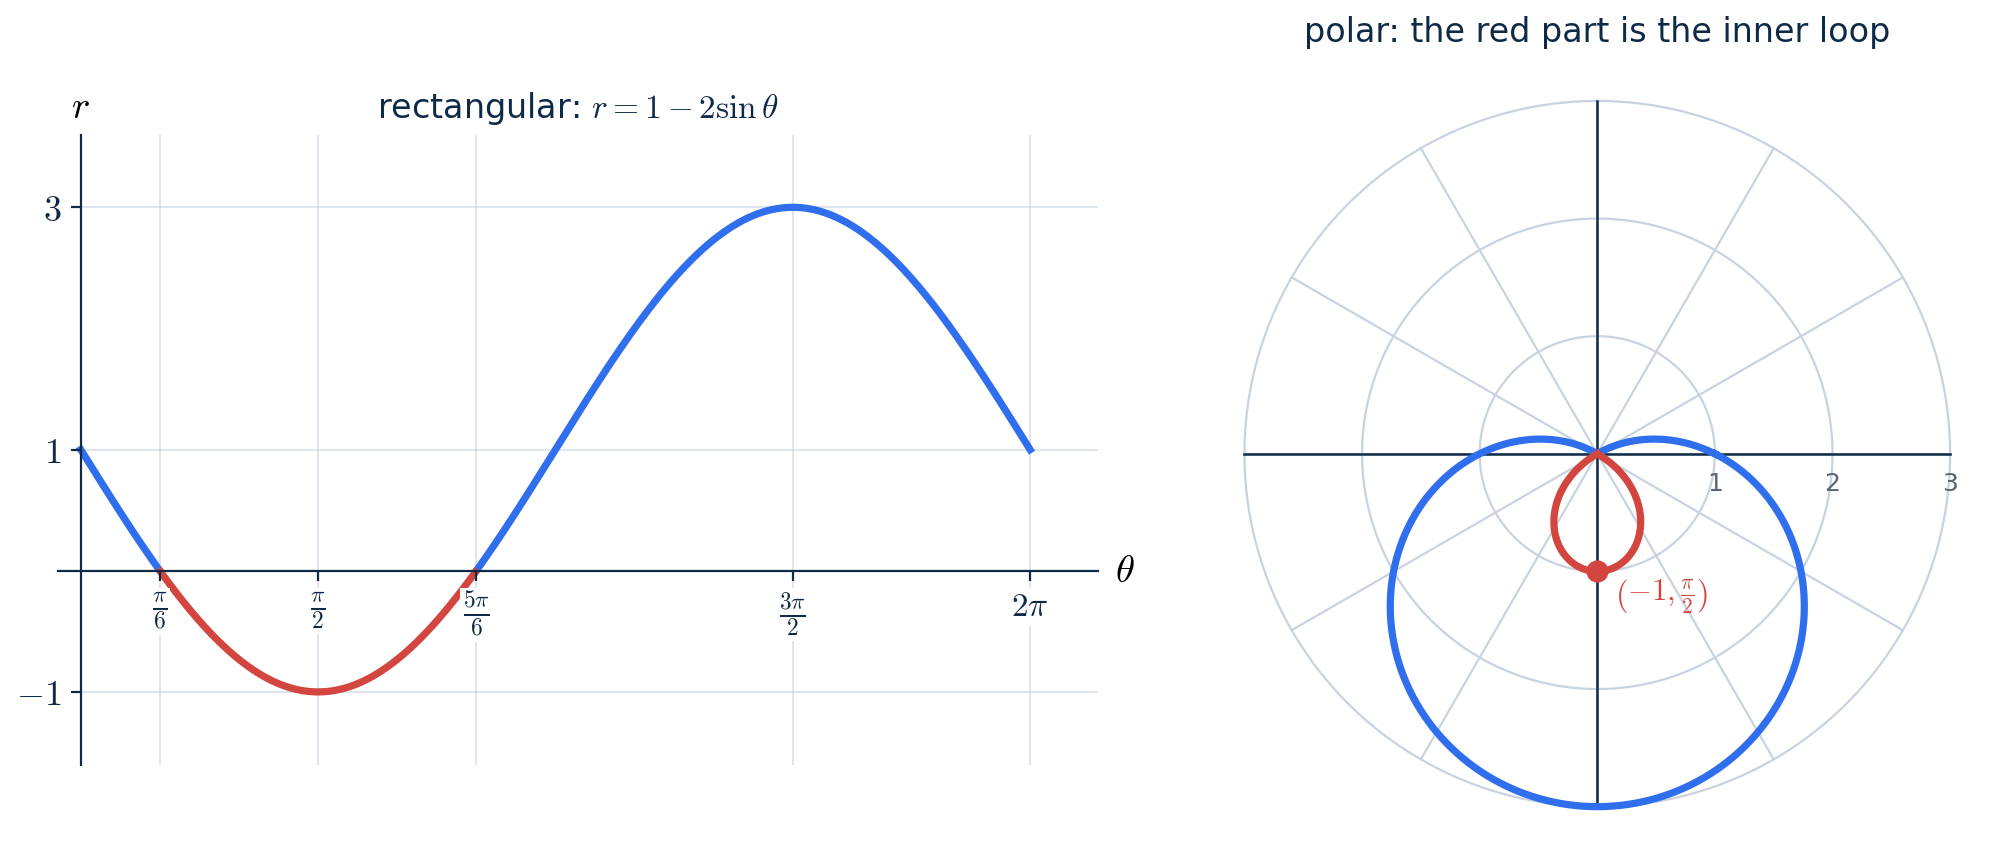
: the red (negative) part becomes an inner loop below the pole.
CONCEPT
What the rectangular graph of tells you
: the point is in the direction . : it is in the direction .
: the curve is at the pole.
large: the point is far from the pole.
increasing: moving away from the pole; decreasing: moving toward it. (3.15 measures how fast.)
Common slips
Deciding the type from the sign of , so that is called something different from .
The type depends only on the sizes a and . The sign of only decides which way the curve points: is widest upward, is widest downward. Both are convex because .
Reading the lowest point of the rectangular graph, at , as "the curve is 1 unit below the pole."
The rectangular graph shows , not height. at means face down and walk backward, which is 1 unit up. The lowest point of the rectangular graph becomes the top of the inner loop.
Lock it in
Try the flashcards
13 cards · Polar, Which polar curve?
Recap card
4 lines to re-read the night before.
- 01
Limaçons or : inner loop if , cardioid if , dimpled if , convex if . The sign of only changes the direction.
- 02
Four-point sketch: find at 0, , , , plot (negative on the opposite side), and connect in order.
- 03
Zeros of are where the curve passes through the pole; stretches with land on the opposite side — that is where inner loops come from.
- 04
Coming up in 3.15: how fast a point moves toward or away from the pole.