
Topic 3.14A
Polar Function Graphs
In 3.13A you plotted one polar point at a time. A polar function is a rule that gives a distance for every angle . Plot all of those points and they draw a curve. This note builds that idea slowly, then gives you a shortcut table so you can recognize common curves from their equations. Part B covers limaçons.
14 MIN READ6 IDEAS42 PROBLEMS13 flashcards
The Flashlight Picture
CONCEPT
How to think about
Stand at the pole holding a flashlight. is the direction the flashlight points; it sweeps counterclockwise as increases.
For each direction , the function tells you how far away the dot of light lands: .
If is negative, the dot lands BEHIND you, on the opposite side of the pole (3.13A).
The polar graph is the path the dot traces as the flashlight sweeps.
Watch this happen for . The dashed line is the flashlight direction and the dark dot is where the light lands. Blue parts have ; red parts have .
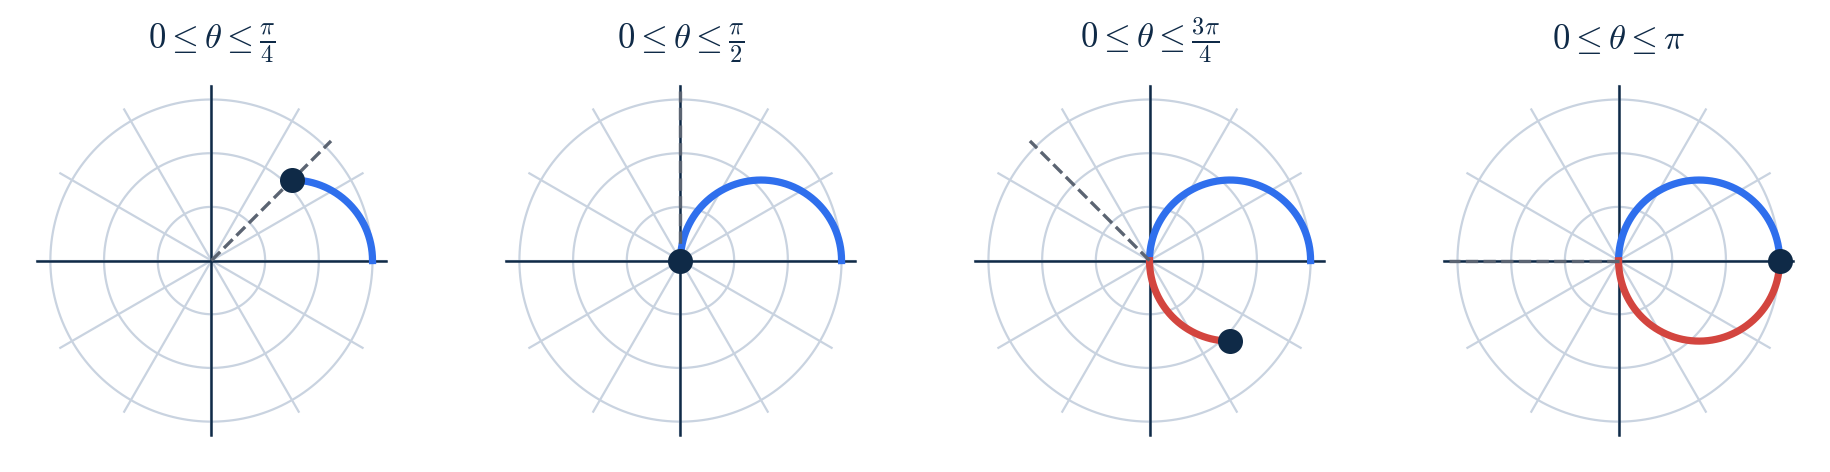
, frame by frame. After , is negative, so the dot lands behind the flashlight and draws the bottom half.
Graphing from a Table
Worked example
Example 1. Graph for using a table.
- 01
Make a table of special angles so the values are exact (3.3).
θ 0 π/6 π/4 π/3 π/2 2π/3 3π/4 5π/6 π r 6 3√3 ≈ 5.20 3√2 ≈ 4.24 3 0 −3 −3√2 −3√3 −6 - 02
Plot each point: face , walk . From to , shrinks from 6 to 0, so the points curve up and into the pole.
- 03
From to , is negative, so each point lands on the OPPOSITE side. For example, is the point , in Quadrant IV. These points draw the bottom half.
- 04
Connect smoothly. The result is a circle of diameter 6 through the pole, centered at . One trip from 0 to draws the whole circle; from to it is drawn again on top of itself.
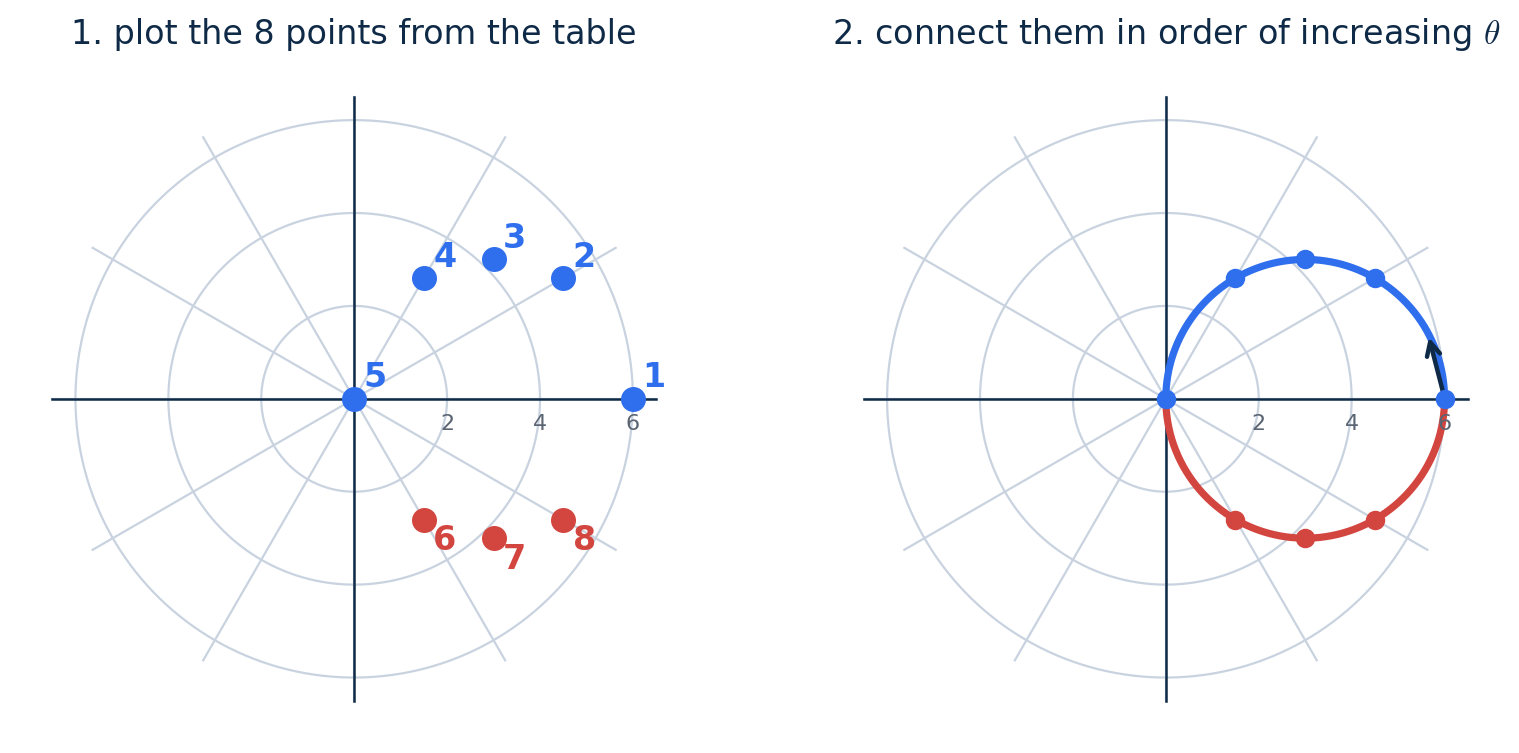
Left: the eight table points, numbered in order. Right: the same points connected as increases.
Here are four of those points in full detail, so nothing is skipped:
# θ r How to plot it Rectangular 1 0 6 face right, walk 6 (6, 0) 2 π/6 5.20 face 30° up, walk 5.20 (4.5, 2.60) 5 π/2 0 face up, walk 0 — you stay at the pole (0, 0) 6 2π/3 −3 face 2π/3, walk BACKWARD 3 (1.5, −2.60) Point 6 is the one to study. The direction points up and to the left, but sends the point down and to the right instead, into Quadrant IV. Points 6, 7, and 8 all do this, and together they draw the bottom half of the circle.
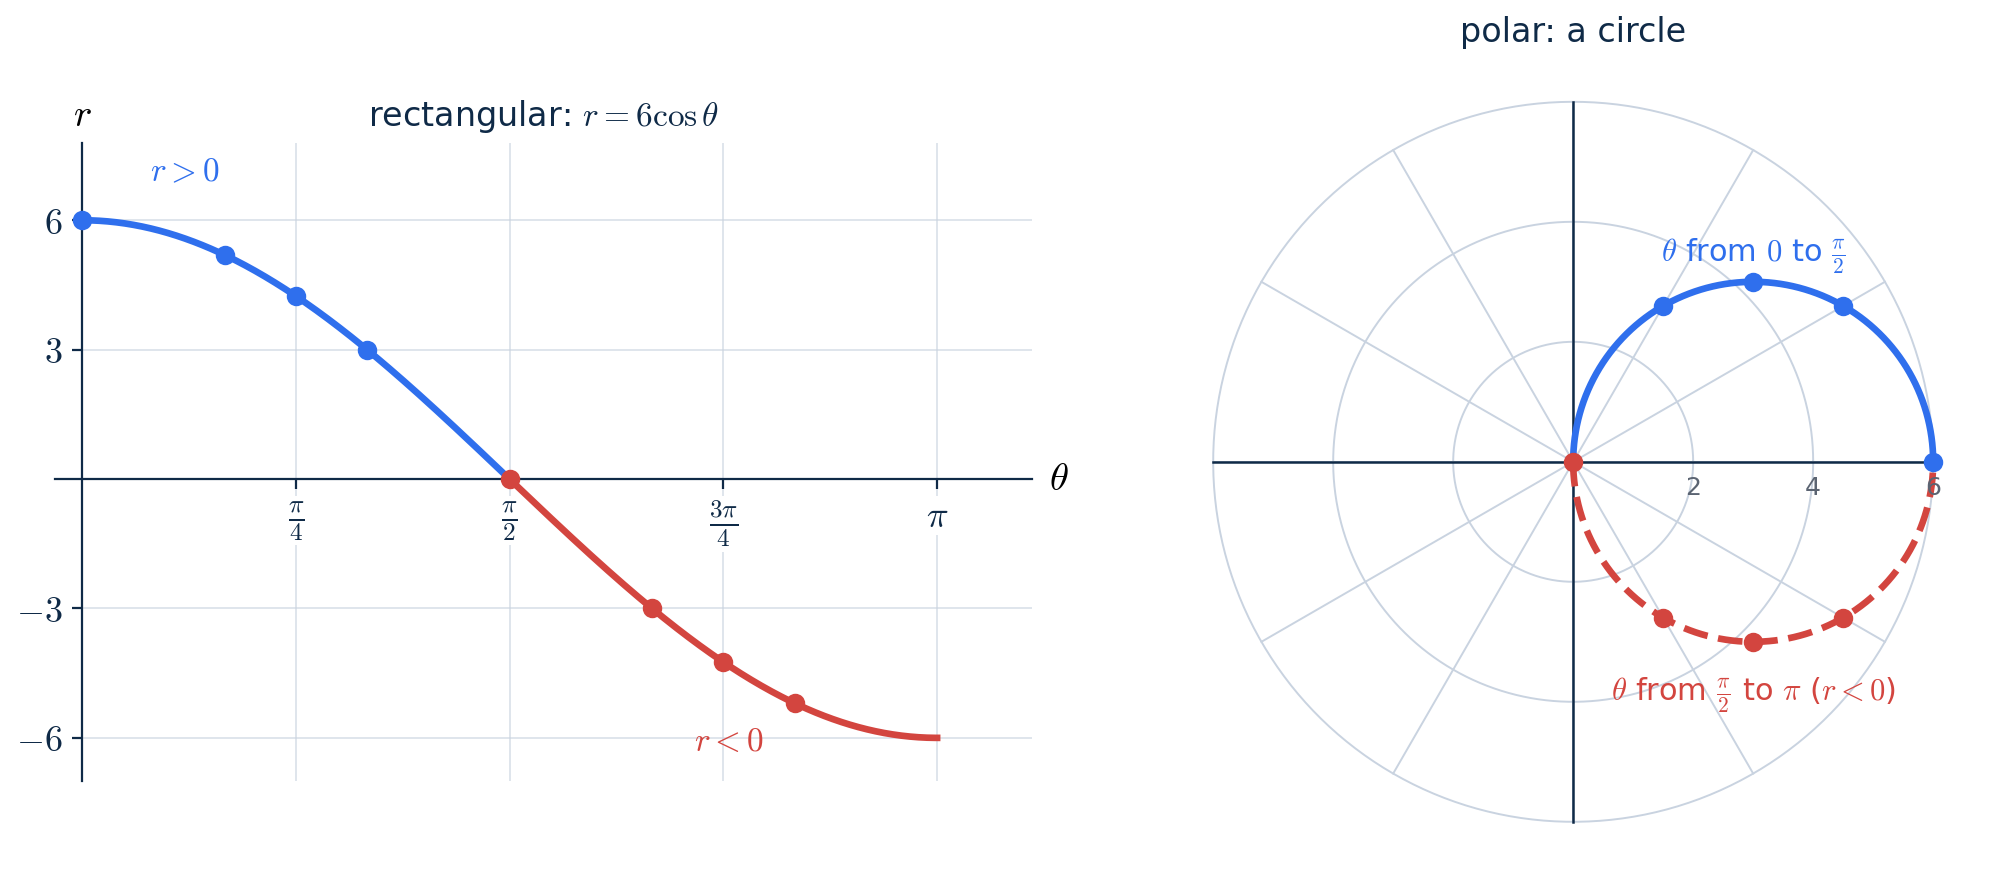
Left: against in a rectangular plane. Right: the same function in the polar plane. Colors match.
The left picture — plotted against like an ordinary function — is called the rectangular graph of . It is a quick way to see where is positive, negative, or zero. Part B uses it a lot.
COMMON MISTAKE
Plotting at distance 3 along the ray, in Quadrant II.
A negative means the dot lands behind you (3.13A): the direction is , in Quadrant IV. If you skip this, the "bottom half" gets drawn on top of the top half and the circle never closes.
What about from to ? Nothing new appears: the curve is drawn a second time, exactly on top of the first. That is why we say the circle is COMPLETE on , and traced twice on .
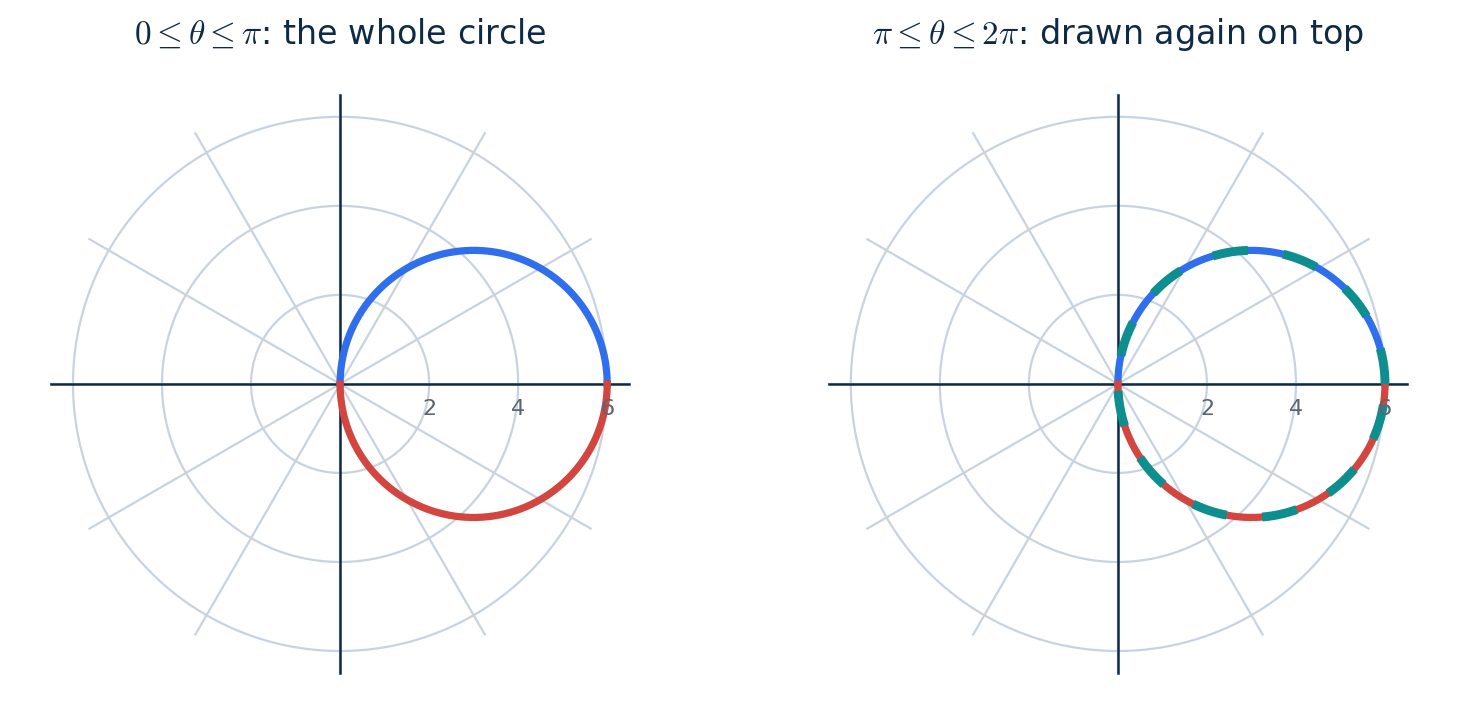
Right: the second trip (dashed teal) lands on the same circle.
CONCEPT
How to graph any polar function
-
Make a table. Use , , , , , … — enough angles to see the shape.
-
Mark the special values: where (the curve is at the pole) and where is largest (the curve is farthest out).
-
Mark where is negative. Those points go on the opposite ray.
-
Plot the points and number them in order of increasing .
-
Connect them in that order, smoothly. Then ask: has the curve closed? If not, keep going with larger .
COMMON MISTAKE
Plotting the table points correctly, then connecting the nearest dots to each other.
A polar curve must be traced in order of increasing , like following a path. In Example 1 the nearest neighbor of point 5 (the pole) looks like point 4, but the path goes 5 → 6, which jumps to the other side of the pole. Number your points as you plot them and follow the numbers.
Circles and Lines
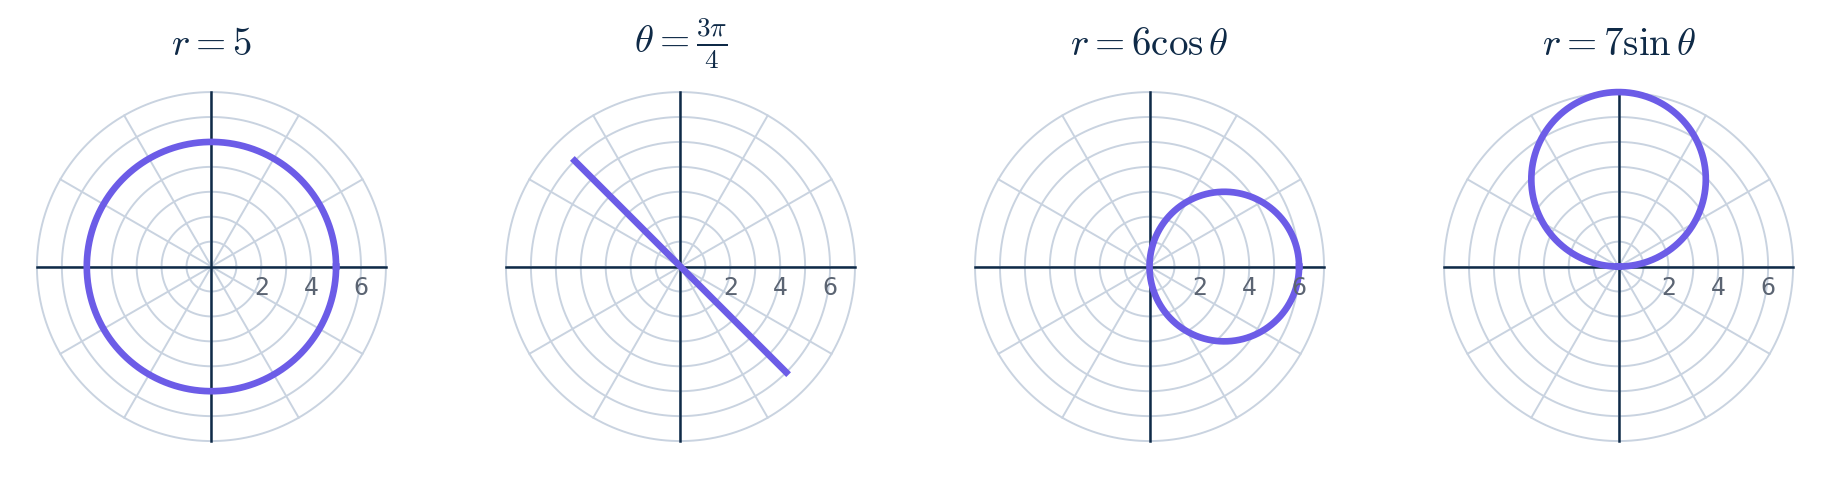
Four basic polar graphs.
| Equation | Graph | Why |
|---|---|---|
| r = c | circle, radius |c|, centered at the pole | every point is c from the pole |
| θ = c | line through the pole | every point is on the ray at angle c (or its opposite, r < 0) |
| r = a cos θ | circle, diameter |a|, through the pole, on the x-axis | r = 0 at θ = π/2 |
| r = a sin θ | circle, diameter |a|, through the pole, on the y-axis | r = 0 at θ = 0 |
Why is circle? Multiply by : . By 3.13A, and , so , which rearranges to : a circle centered at with radius 3. In the same way is the circle centered at with radius 3.5.
Which side is the circle on? For , the point at is . If the circle is on the right; if , on the left. For , check : the circle is above the pole if and below if .
Remember from 3.11 that . The graph of is not a curve at all: means , a vertical line.
Quick check
Describe the graph of .
Rose Curves
Let us build one rose slowly: . Start with a small table.
| θ | 0 | π/12 | π/6 | π/4 | π/2 | 3π/4 | π |
|---|---|---|---|---|---|---|---|
| r = 5 cos 2θ | 5 | 4.33 | 2.5 | 0 | −5 | 0 | 5 |
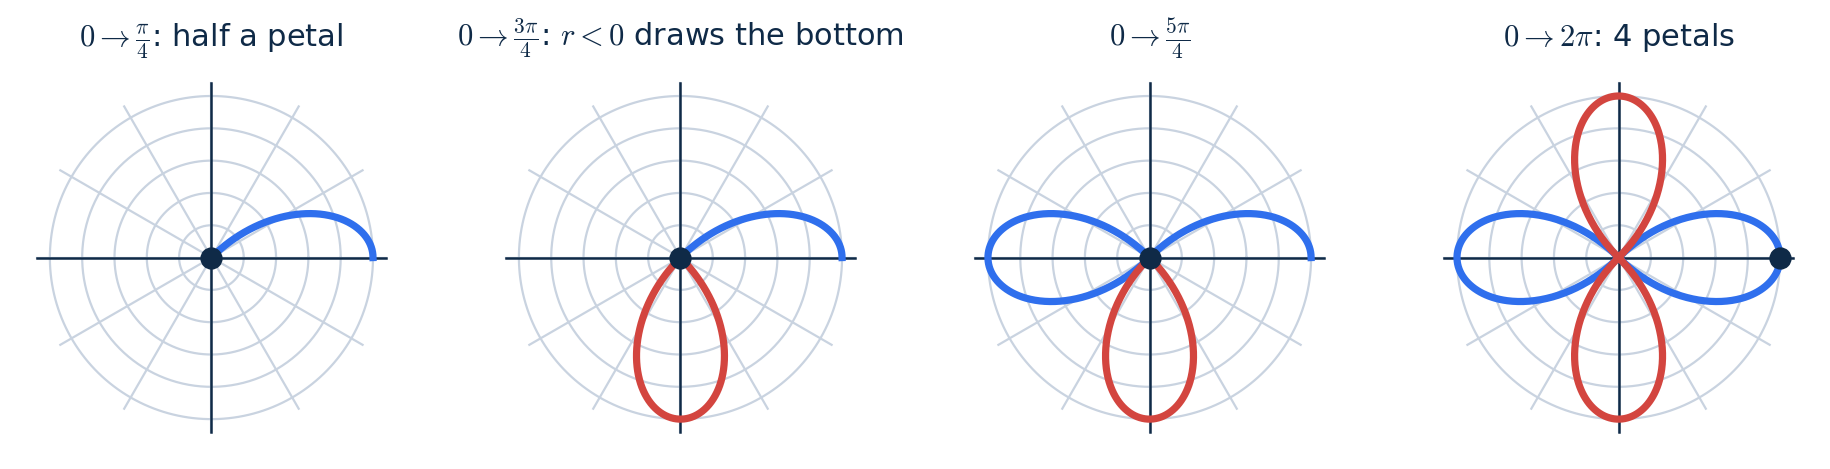
Building . Blue: . Red: , so those points land on the opposite side.
From to , shrinks from 5 to 0: that is half of a petal pointing right. From to , is negative, reaching −5 at . Facing up and walking backward 5 lands at the bottom, so this part draws a petal pointing DOWN. Keep going and the petals keep appearing: 4 in all by .
Worked example
Example 2. Graph . Which θ-interval draws each petal?
| θ | 0 | π/8 | π/4 | 3π/8 | π/2 | 5π/8 | 3π/4 | 7π/8 | π |
|---|---|---|---|---|---|---|---|---|---|
| r | 0 | 2.83 | 4 | 2.83 | 0 | −2.83 | −4 | −2.83 | 0 |
- 01
From to the values go 0 → 4 → 0, all positive: the curve leaves the pole, reaches out 4 units at , and comes back. That is petal 1, pointing toward (Quadrant I).
- 02
From to the values go 0 → −4 → 0, all negative. At the direction is up-left, but sends the point down-right, to . So petal 2 lands in Quadrant IV.
- 03
From to the values are positive again: petal 3 points toward (Quadrant III). From to they are negative: petal 4 lands in Quadrant II.
- 04
Four petals, each of length 4, pointing toward , , , and . Each petal takes a quarter of a turn to draw.
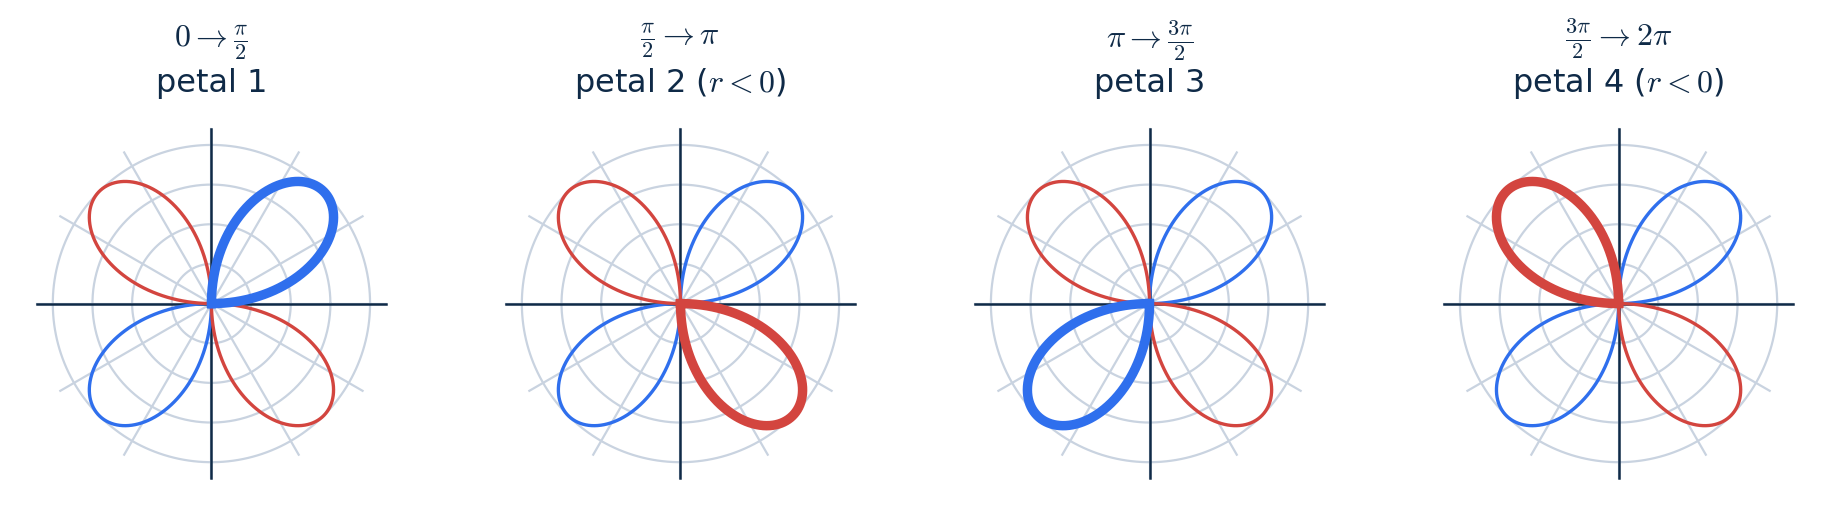
One quarter-turn of draws one petal. The red petals are the ones made by negative .
CONCEPT
Rose rules ( a whole number, )
Each petal has length , the largest value of .
If is odd: petals, drawn completely for .
If is even: 2n petals, drawn completely for .
A petal tip occurs wherever . With cosine there is always a tip on the positive x-axis (, ).
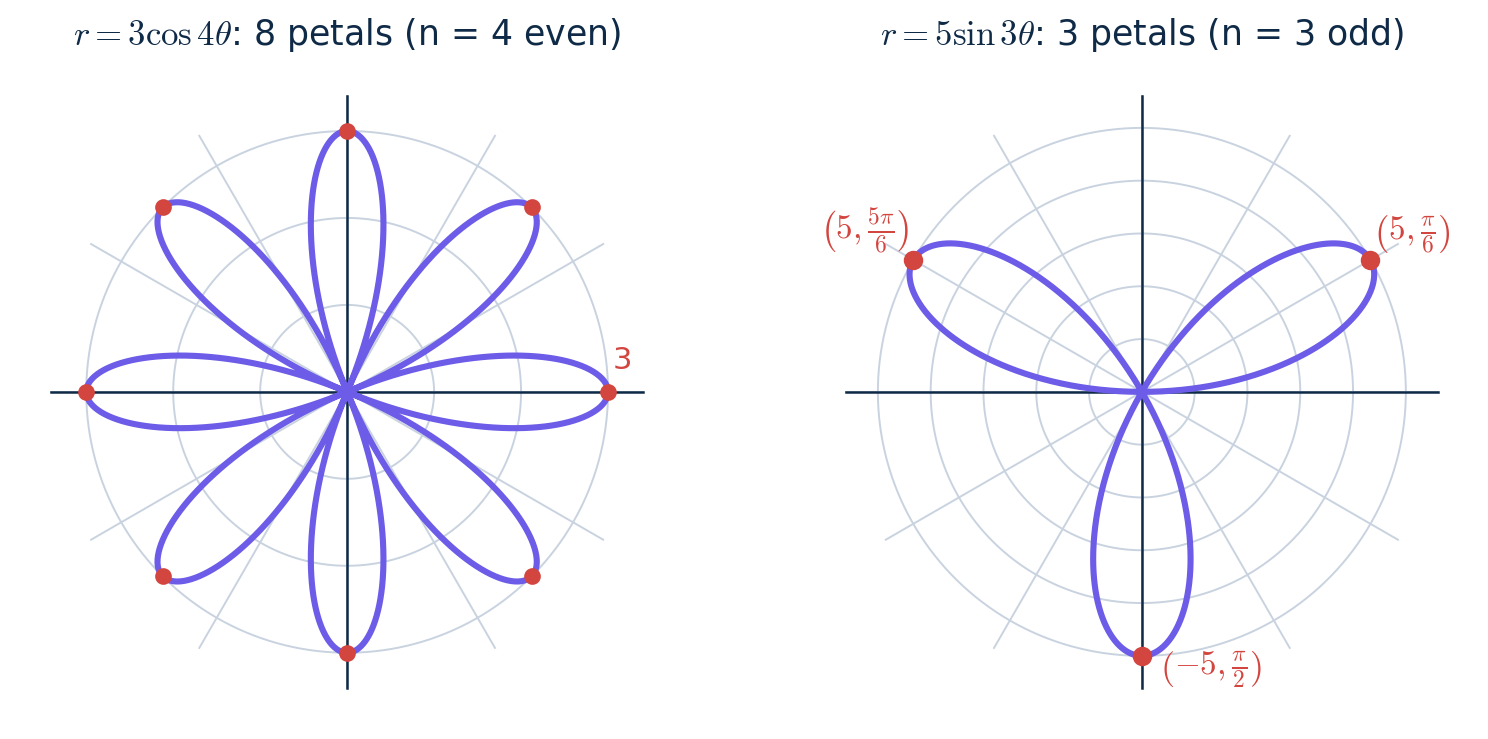
Left: has petals. Right: has 3 petals.
Worked example
Example 3. Describe : the number and length of its petals, where the tips are, and the smallest θ-interval that draws it once.
- 01
is odd, so there are 3 petals, each of length 5, and draws the whole rose.
- 02
Tips are where : , , , so , , .
- 03
and point into Quadrants I and II. But , so that tip points the OPPOSITE way, straight down, to .
- 04
The three petals point toward , , and — evenly spaced, apart.
COMMON MISTAKE
" has 4 petals, one for each ."
When is even, the negative values of draw a whole second set of petals BETWEEN the positive ones — exactly what happened with above, where the red petals appeared at top and bottom. Count the tips: one every , so 8.
Quick check
How many petals does have, and how long is each?
Recognizing a Graph from Its Equation
| If the equation looks like… | the graph is… | Size / count |
|---|---|---|
| r = c | circle centered at the pole | radius |c| |
| θ = c | line through the pole | — |
| r = a cos θ or r = a sin θ | circle through the pole | diameter |a| |
| r = a cos nθ or r = a sin nθ | rose | n odd: n petals; n even: 2n petals; length |a| |
| r = a + b cos θ or r = a + b sin θ | limaçon (3.14B) | four shapes |
Worked example
Example 4. Name each graph and give its size: , , , , .
- 01
: circle centered at the pole, radius 4.
- 02
: circle of diameter 3 through the pole. , so it sits on the LEFT: at , , the point .
- 03
: rose, even → 8 petals of length 2. : rose, odd → 5 petals of length 3.
- 04
: a line through the pole at angle (it slopes down to the right).
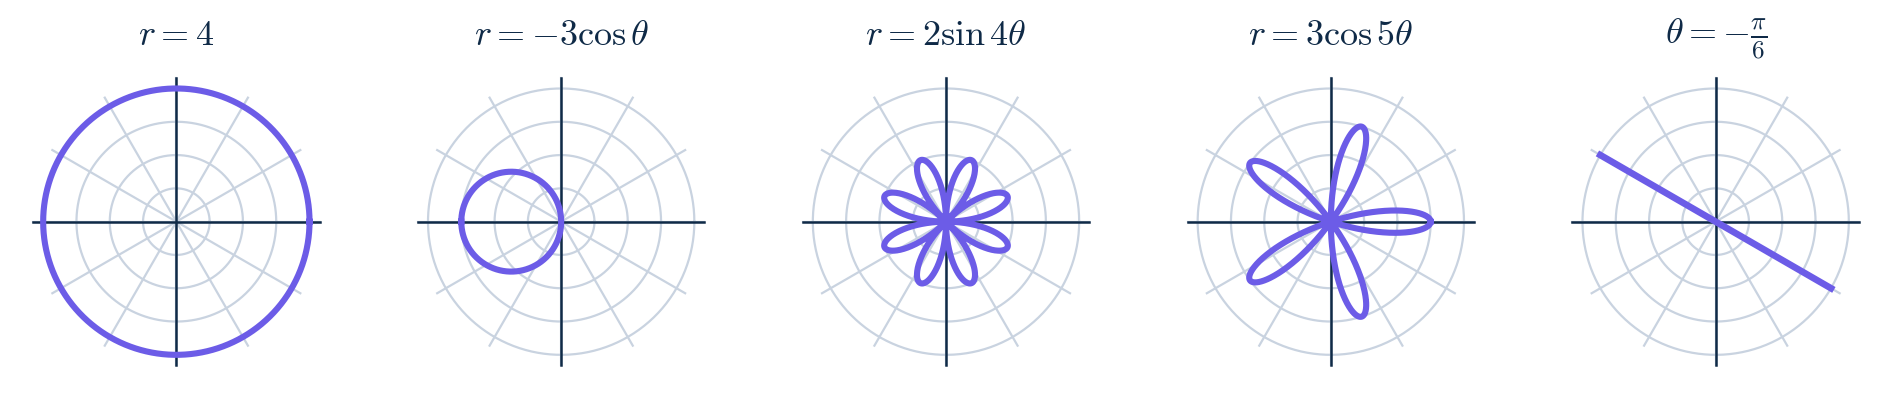
The five graphs from Example 3, in order.
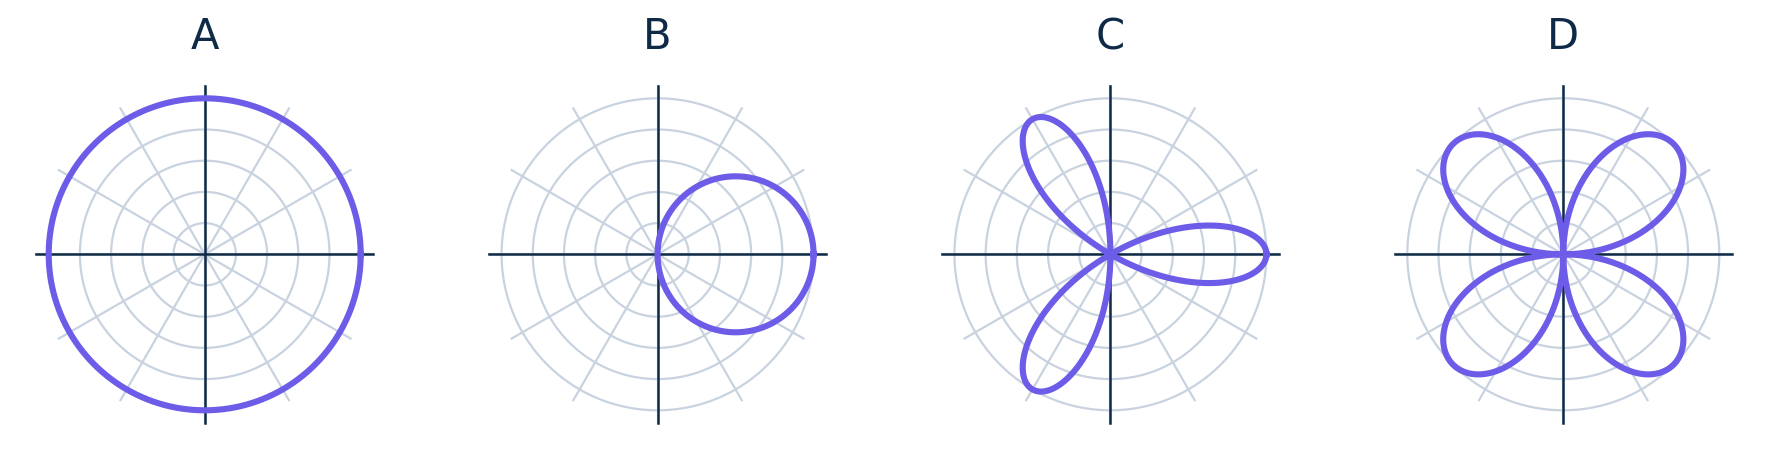
Match: which graph is , , , ?
Matching answers: A is (circle about the pole). is (circle of diameter 5 on the right). is (3 petals, one pointing right). is (4 petals along the diagonals).
CONCEPT
Try it yourself
-
How many petals does have? How long are they?
-
Describe .
-
Which θ-interval draws exactly once?
Answers: 1. is even → 4 petals, each 6 long. 2. A circle of diameter 5 through the pole, above it (center ). 3. , because is odd.
Common slips
Plotting at distance 3 along the ray, in Quadrant ii.
A negative means the dot lands behind you (3.13A): the direction is , in Quadrant iv. If you skip this, the "bottom half" gets drawn on top of the top half and the circle never closes.
Plotting the table points correctly, then connecting the nearest dots to each other.
A polar curve must be traced in order of increasing , like following a path. In Example 1 the nearest neighbor of point 5 (the pole) looks like point 4, but the path goes 5 → 6, which jumps to the other side of the pole. Number your points as you plot them and follow the numbers.
" has 4 petals, one for each ."
When is even, the negative values of draw a whole second set of petals between the positive ones — exactly what happened with above, where the red petals appeared at top and bottom. Count the tips: one every , so 8.
Lock it in
Try the flashcards
13 cards · Polar, Which polar curve?
Recap card
5 lines to re-read the night before.
- 01
: as the direction sweeps around, the point lands at distance ; negative lands on the opposite side.
- 02
Graph from a table of special angles, or read the rectangular graph of against to see where is positive, negative, or zero.
- 03
is a circle about the pole; is a line through the pole; and are circles of diameter through the pole.
- 04
Roses , : petal length ; petals if is odd (drawn on ), 2n petals if is even (drawn on ).
- 05
Coming up in 3.14B: limaçons, and reading a polar graph from its rectangular graph.