
Topic 2.6
Competing Function Model Validation
Nova just launched a new video series. Its total views (in thousands) at the end of each week look like they're curving upward, but many functions curve upward. A linear model, a quadratic model and an exponential model could all be fitted to the same data, and a calculator will happily produce all three. Which one should we trust?
9 MIN READ7 IDEAS33 PROBLEMS6 flashcards
Read this first
30 sec
- 01
Appropriate model → residuals show no pattern. Pattern → wrong type of model.
Remember from 2.2 and 2.5B: linear change is additive, exponential change is proportional, and a regression gives the best curve of a chosen type. This note is about choosing the TYPE: using the data's pattern, the context, and a new tool called residuals.
Three Kinds of Change
| model | what the data does over equal x-steps | typical context |
|---|---|---|
| linear | differences are roughly constant | a fixed amount added per unit (a plan that charges $4 per GB) |
| quadratic | differences change at a roughly constant rate (2nd differences roughly constant) | area from a length (pizza area from its diameter), height of a thrown ball |
| exponential | ratios are roughly constant | a fixed percent per unit (growth, decay, doubling, half-life) |
Remember from Unit 1: a quadratic is the function whose rate of change changes at a constant rate. That is why its second differences are constant, just as a linear function's first differences are.
Here is what “second differences” means with a simple example. For at , 2, 3, 4, 5, the outputs are 1, 4, 9, 16, 25. The first differences (subtract neighbors) are 3, 5, 7, 9: not constant, so not linear. Now subtract THOSE: 2, 2, 2. Constant second differences are the fingerprint of a quadratic.
| x | 1 | 2 | 3 | 4 | 5 |
|---|---|---|---|---|---|
| y = | 1 | 4 | 9 | 16 | 25 |
| 1st differences | — | 3 | 5 | 7 | 9 |
| 2nd differences | — | — | 2 | 2 | 2 |
Nova's New Series
| w (week) | 0 | 1 | 2 | 3 | 4 | 5 | 6 | 7 | 8 |
|---|---|---|---|---|---|---|---|---|---|
| views (thousands) | 12.4 | 16.3 | 24.1 | 32.7 | 45.5 | 65.0 | 90.7 | 125.8 | 177.5 |
Worked example
Use the data's patterns to decide which kind of model is most appropriate.
- 01
Differences: 3.9, 7.8, 8.6, 12.8, 19.5, 25.7, 35.1, 51.7. They keep growing, so linear is out.
- 02
Second differences: 3.9, 0.8, 4.2, 6.7, 6.2, 9.4, 16.6. They are not roughly constant; they grow too. That's a warning sign for quadratic.
- 03
Ratios: 1.31, 1.48, 1.36, 1.39, 1.43, 1.40, 1.39, 1.41. After the first week they stay close to 1.4. The outputs change roughly proportionally, so an exponential model is the best choice.
Here are all three regressions drawn on the data:
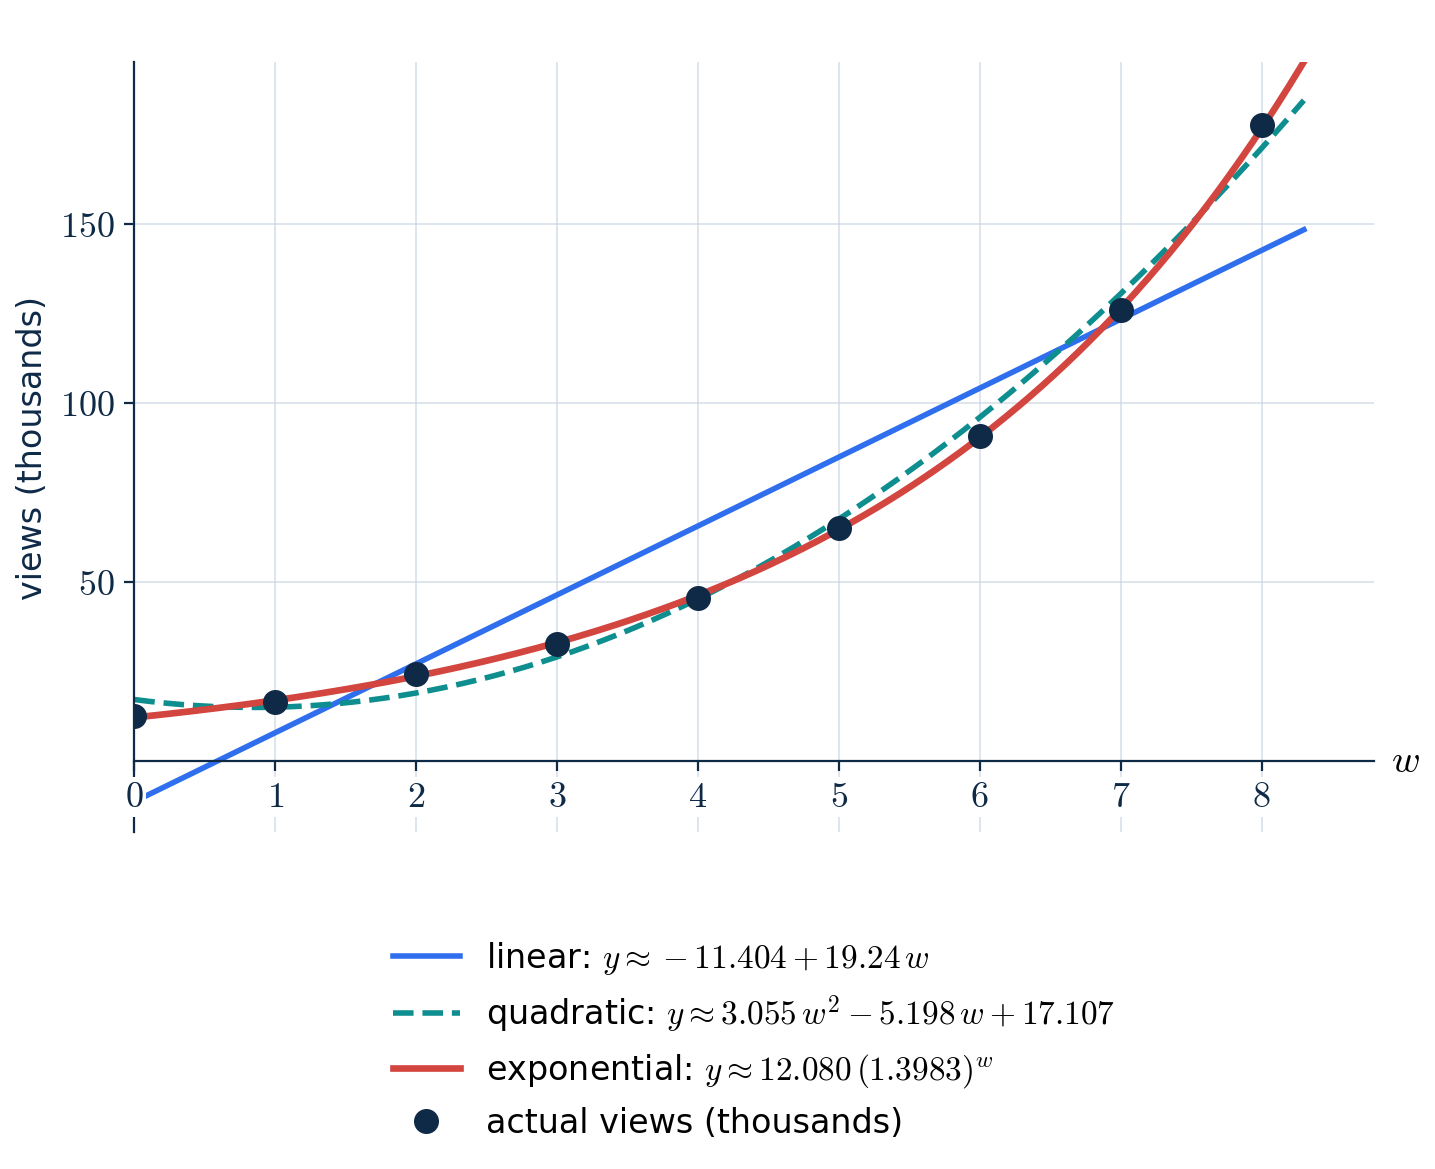
The line clearly misses. The quadratic and the exponential both look close. Looking at the graph alone isn't enough to decide between them.
Residuals
CONCEPT
What a Residual Is
For each data point, the model makes a prediction. The residual is how far the actual value is from that prediction.
Positive residual: the actual value is ABOVE the model, so the model underestimated. Negative residual: the actual value is BELOW the model, so the model overestimated.
REAL-LIFE EXAMPLE
Ridge's Real Numbers
In 2.1 we modeled Ridge with . Its actual counts for months 0 to 6 were 1180, 1530, 1790, 2120, 2350, 2710, 2990.
At month 4 the model predicts , but the actual count was 2350. Residual = : the model overestimated by 50 subscribers.
All seven residuals: −20, 30, −10, 20, −50, 10, −10. They bounce above and below 0 with no trend, which is exactly what a good model's residuals look like.
COMMON MISTAKE
“Residual = predicted − actual.”
The order is actual − predicted. Getting it backwards flips every sign, and then “underestimate” and “overestimate” get swapped. A quick check: if the point is above the curve, the residual must be positive.
Worked example
Example (by hand). A linear model was fitted to the data , , , . Find each residual and say whether the model over- or underestimated.
- 01
Predicted values: , , , .
- 02
Residuals = actual − predicted: , , , .
- 03
Signs: + (underestimate at ), − (overestimate at ), + (under at ), − (over at ). They alternate and stay small, with no pattern, so the linear model is appropriate for this data.
Residual Plots: Look for a Pattern
A residual plot graphs each residual against its input. The rule is simple: if the model is the right type, the residuals are scattered randomly above and below 0. If they form a pattern, the model is systematically missing something.
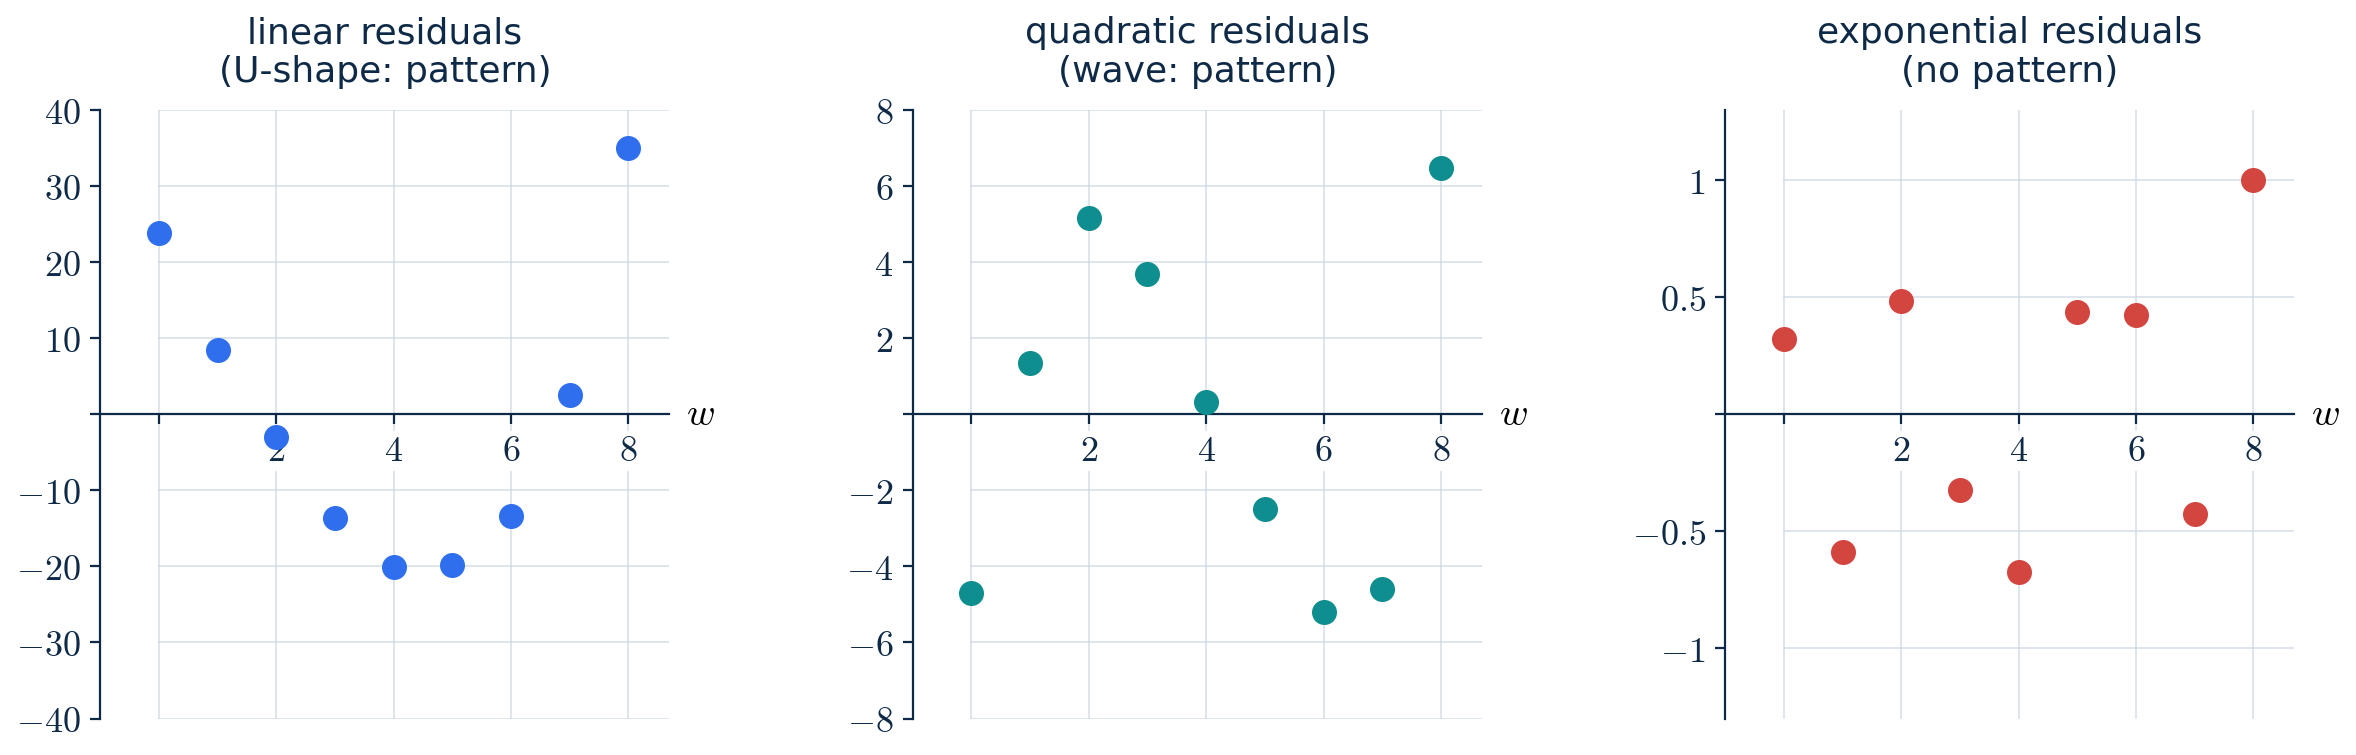
Residuals of the three models for Nova's series. Notice the different vertical scales: the linear residuals reach 35, the quadratic 6.5, the exponential only 1.0.
- 01
Linear: positive at both ends, negative in the middle, a U-shape. The data curves and the line can't. Not appropriate.
- 02
Quadratic: negative, then positive (weeks 1 to 4), then negative (weeks 5 to 7), then positive. The residuals change sign in long runs, a wave. The quadratic bends at the wrong rate. Not appropriate.
- 03
Exponential: the signs jump around with no shape. Appropriate, and it matches the conclusion from the ratios.
KEY RULE
Appropriate model → residuals show NO pattern. Pattern → wrong type of model.
COMMON MISTAKE
“The linear model has , which is close to 1, so it's a good model.”
A high only says the points roughly go up together; it does not say the right shape was chosen. The linear residuals form a clear , so the linear model is not appropriate despite its .
“The quadratic residuals are small, so the quadratic is fine.”
Small is not the test; patternless is. A pattern of small residuals still means the model is the wrong shape, and the errors will grow once you predict beyond the data: at week 10 the exponential model predicts about 345.1 thousand views but the quadratic only about 270.6.
Quick check
A residual plot has points above and below zero, but they trace a clear U shape. Is the model appropriate?
Overestimate or Underestimate?
Sometimes the context tells you which kind of error is worse.
REAL-LIFE EXAMPLE
Ordering Milk for a Café
A café's model predicted it would need 42 liters of milk on Saturday. It actually used 45 liters. Residual = liters: the model underestimated, and the café ran out before closing.
For the café, an overestimate (a little extra milk) is a smaller problem than an underestimate (turning customers away). In a situation like this, a model that tends to overestimate slightly is preferable.
Worked example
Try it yourself. Which type of model (linear, quadratic, or exponential) fits each situation best? Explain in one phrase. (a) the cost of a phone plan: $15 per month plus $4 per GB (b) the area of a circular pizza as a function of its diameter (c) a rumor where each person tells two new people every hour
Answers: (a) Linear: a constant $4 is added per GB. (b) Quadratic: area depends on the diameter squared. (c) Exponential: the number of people is multiplied by the same factor every hour.
Quick check
A model predicts at ; the actual value was . What is the residual, and did the model over- or underestimate?
Practice
Worked example
P1. Using the model , predict at . The actual value was 14.8. Find the residual and interpret it.
Answer: Predicted . Residual = : the model overestimated by 0.8.
Worked example
P2. An exponential regression's residual plot shows residuals positive at both ends and negative in the middle. Is the exponential model appropriate?
Answer: No. The residuals form a U-shaped pattern, so the model is systematically off. Try a different type of model.
Worked example
P3. The area of a square garden is recorded for side lengths 1, 2, 3, 4, 5 m. Which type of model should fit, and what should its second differences look like?
Answer: Quadratic (area = side²). The second differences should be constant (2, 2, 2).
Common slips
“Residual = predicted − actual.”
The order is actual − predicted. Getting it backwards flips every sign, and then “underestimate” and “overestimate” get swapped. A quick check: if the point is above the curve, the residual must be positive.
“The linear model has , which is close to 1, so it's a good model.”
A high only says the points roughly go up together; it does not say the right shape was chosen. The linear residuals form a clear , so the linear model is not appropriate despite its .
“The quadratic residuals are small, so the quadratic is fine.”
Small is not the test; patternless is. A pattern of small residuals still means the model is the wrong shape, and the errors will grow once you predict beyond the data: at week 10 the exponential model predicts about 345.1 thousand views but the quadratic only about 270.6.
Lock it in
Try the flashcards
6 cards · Semi-log plots and residuals
Recap card
6 lines to re-read the night before.
- 01
Linear: roughly constant differences. Quadratic: roughly constant second differences. Exponential: roughly constant ratios. Context often decides too.
- 02
Residual = actual − predicted. Positive → the model underestimated; negative → it overestimated.
- 03
An appropriate model has a residual plot with no pattern. A U-shape, a wave, or any trend means the wrong type of model.
- 04
A high or small residuals do not prove the model type is right; the pattern of the residuals does.
- 05
In context, decide whether overestimating or underestimating is the worse mistake.
- 06
Next, in 2.7: putting functions inside other functions, composition.