
Topic 2.5B · CED: Exponential Function Context and Data Modeling
Exponential Context and Data Modeling
In 2.5A every model came from exact information: a percent, a half-life, or two points. Real data is messier. Nova's actual subscriber counts don't multiply by exactly 1.5 every month. And some quantities, like a cooling cup of coffee, don't fade toward 0 at all; they level off at room temperature.
10 MIN READ5 IDEAS34 PROBLEMS18 flashcards
Remember from 2.5A: an exponential model needs an initial amount and factor . This note shows how to get and from a whole data set, and how to handle data whose asymptote is not .
Real Data: Nova's Actual Counts
Here are Nova's real end-of-month subscriber counts:
| t (month) | 0 | 1 | 2 | 3 | 4 | 5 | 6 | 7 | 8 |
|---|---|---|---|---|---|---|---|---|---|
| subscribers | 250 | 390 | 560 | 880 | 1270 | 1990 | 2870 | 4450 | 6490 |
The ratios of consecutive counts are 1.56, 1.44, 1.57, 1.44, 1.57, 1.44, 1.55, 1.46. They are not all equal, so no exponential function fits every point exactly. But they all stay between 1.44 and 1.57, close to one value. That is the sign that an exponential model is reasonable: the data changes roughly proportionally over equal intervals.
CONCEPT
Exponential Regression
No single curve passes through all nine points. Exponential regression picks the and that make the curve as close as possible to ALL the points at once. The curve may not pass through any of them exactly.
It will usually miss some points a little above and some a little below. Those misses are called residuals, and 2.6 is all about them.
Worked example
Example 1. Find an exponential regression model for Nova's data on a TI-84.
- 01
STAT → EDIT: type the months 0 to 8 in L1 and the subscriber counts in L2.
- 02
STAT → CALC → ExpReg, then enter. (To also see , turn on DiagnosticOn first, from the CATALOG.)
- 03
Read the output: , , . Write the model with at least 3 decimal places:
CONCEPT
The Same Regression in Desmos
Step 1. Add a table: put the months in the column and the counts in the column.
Step 2. On a new line type ~ (the ~ means “fit”). Desmos finds and .
Step 3. Desmos may offer a “Log Mode” switch for this regression. With Log Mode ON you get the same numbers as the TI-84: 253.844 and 1.5022. With it OFF, Desmos fits the curve directly and gives 261.83 and 1.4948. Both are reasonable; say which one you used.
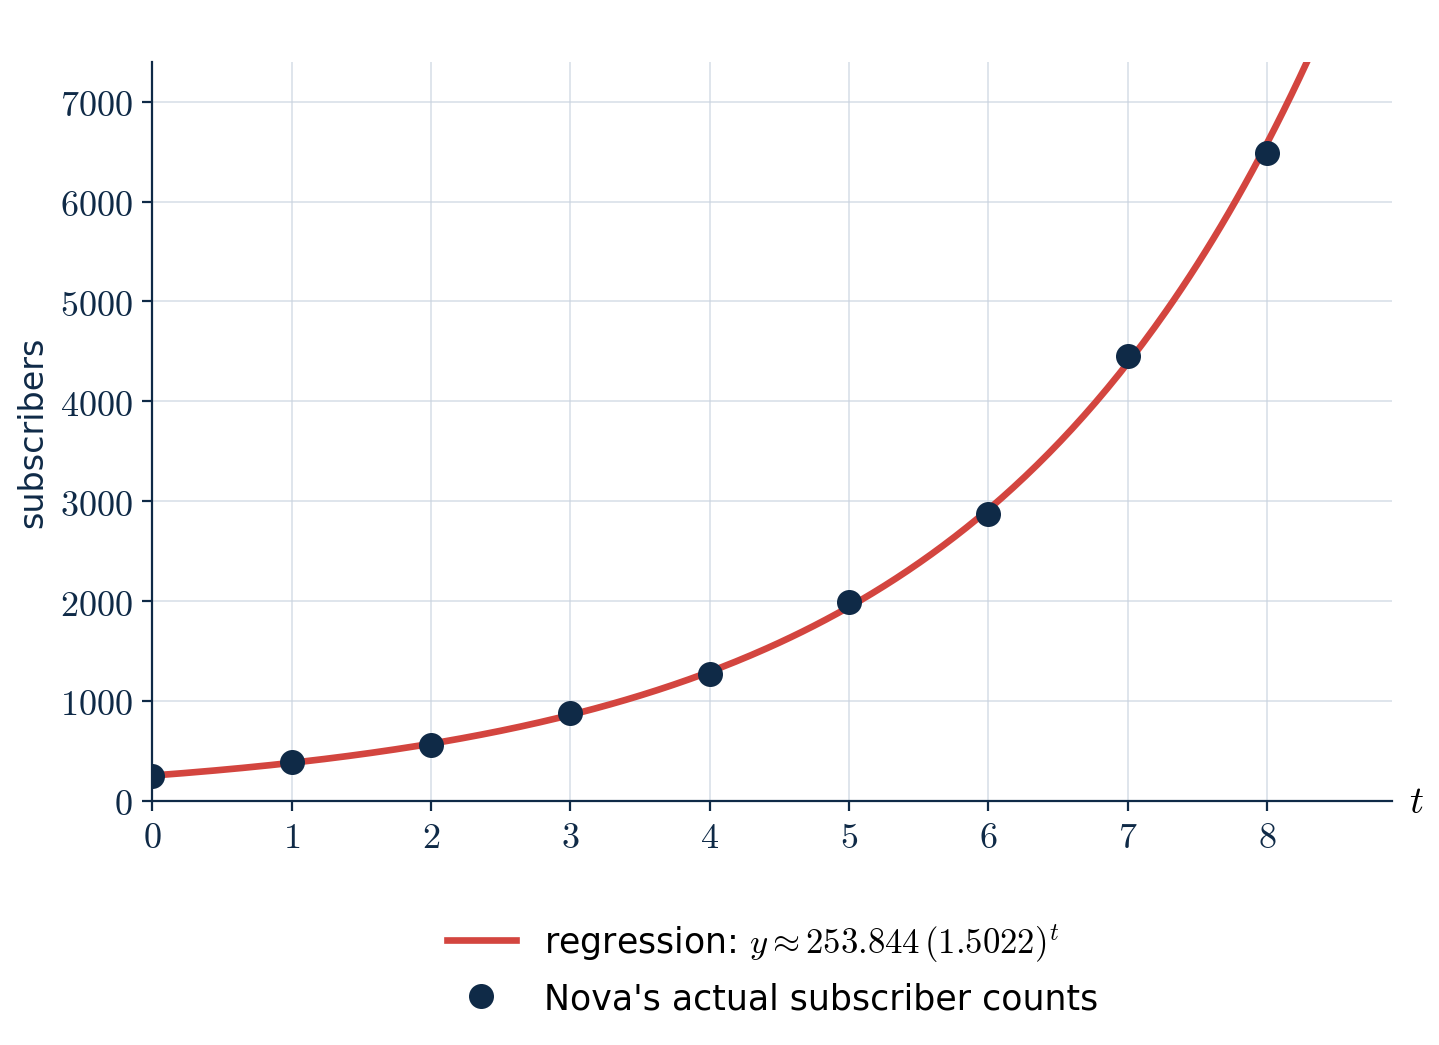
The regression curve runs through the middle of the data. Some points sit slightly above it, some slightly below.
Reading the model: Nova started with about 254 subscribers and grew by a factor of about 1.502 per month, about 50.2% monthly growth. The value is close to 1, which says the data fits an exponential shape very well. (Where exactly comes from is explained in 2.15: it measures how straight the data becomes after taking logarithms.)
For example, at the model predicts about 860.4 subscribers and the actual count was 880, so the model missed by about 19.6.
COMMON MISTAKE
“The first data point is 250, so .”
In a regression model, a is the value the MODEL gives at (here about 253.844), not the first data value. The model is fitted to all the points at once.
“The model is great, so let's predict month 24: about 4.4 million subscribers.”
The data only covers months 0 to 8. Predicting a little past the data (month 10: about 14,849) is reasonable; predicting far past it assumes the channel keeps growing 50% a month for two years. Real growth usually slows down. Be careful when you extrapolate.
When the Asymptote Is Not y = 0
A cup of coffee at 84 °C sits in a 20 °C room. Here is its temperature every 5 minutes:
| t (minutes) | 0 | 5 | 10 | 15 | 20 |
|---|---|---|---|---|---|
| T (°C) | 84 | 68 | 56 | 47 | 40.25 |
| change | — | −16 | −12 | −9 | −6.75 |
Run the ratio test from 2.2: , , . Not constant. Is the coffee not exponential? It is. The problem is that the coffee cools toward 20 °C, not toward 0 °C. What decays proportionally is the DIFFERENCE between the coffee and the room:
| t (minutes) | 0 | 5 | 10 | 15 | 20 |
|---|---|---|---|---|---|
| T − 20 | 64 | 48 | 36 | 27 | 20.25 |
| ratio | — | 0.75 | 0.75 | 0.75 | 0.75 |
CONCEPT
Vertically Translated Exponential Functions
is the graph of moved up units. Its horizontal asymptote is instead of .
Subtracting from the outputs gives back pure proportional change. For the coffee, and every 5 minutes the gap to room temperature shrinks by the factor 0.75.
Worked example
Example 2. Build the coffee model.
- 01
is the value being approached: the room temperature, .
- 02
a is the starting GAP, not the starting temperature: .
- 03
The gap is multiplied by 0.75 every 5 minutes, so after minutes it has been multiplied t/5 times (2.5A):
- 04
Per minute (2.4): , so the gap shrinks about 5.6% each minute:
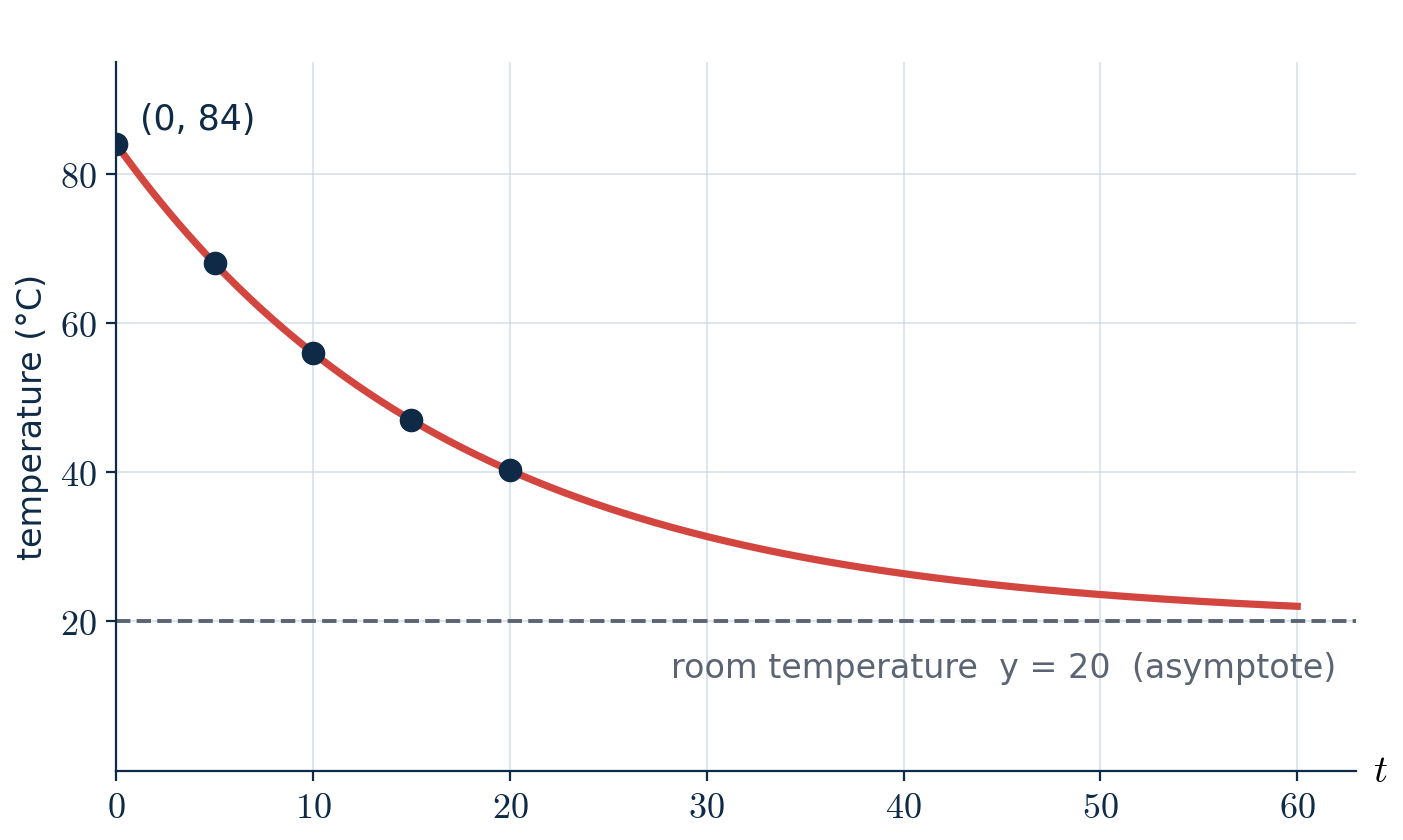
The coffee approaches the room temperature , not 0. After an hour it is still slightly warm: °C.
COMMON MISTAKE
“The coffee's temperature will eventually reach 0 °C.”
The asymptote is . The model says the coffee gets closer and closer to room temperature, which is also what a real cup does. Always ask what value the quantity is approaching, and that is your .
“, the starting temperature.”
In + k, the value at is a + k, not a. So : the part that is actually decaying.
Quick check
Tea cools by . What is , and what value does approach?
Finding k From a Table
In context, usually comes from the situation. Without context, look at the DIFFERENCES of consecutive outputs. For , the cancels when you subtract:
So the differences themselves are an exponential pattern with the SAME factor . In particular, the first difference is
Worked example
Example 3. : 0, 1, 2, 3, 4 and : 1, 4, 13, 40, 121. Show that is a translated exponential function and find it.
- 01
The x-steps are all 1. Ratios of : 4, , , , not constant. So is not a plain .
- 02
Differences: 3, 9, 27, 81. Their ratios are , constant. So with .
- 03
First difference = : , so .
- 04
, so . Result: . Check: ✓.
COMMON MISTAKE
“The ratios of aren't constant, so is not exponential.”
That only rules out with asymptote . When the ratio test fails, check whether the DIFFERENCES have a constant ratio. If they do, the function is exponential with a vertical shift.
Worked example
Try it yourself. : 0, 1, 2, 3, 4 and : 50, 26, 14, 8, 5. Write in the form + k. What is the horizontal asymptote?
Answer: Differences −24, −12, −6, −3 have ratio , so . gives , and . . Check: ✓. The asymptote is .
Quick check
A function of the form has outputs at . Find and .
Practice
Worked example
P1. Use Nova's regression model to predict month 9. Is this a reasonable prediction?
Answer: . Month 9 is just past the data (months 0 to 8), so the prediction is reasonable.
Worked example
P2. : 0, 1, 2, 3, 4 and : 10, 16, 19, 20.5, 21.25. Find and describe what happens in the long run.
Answer: Differences 6, 3, 1.5, 0.75 have ratio , so . gives , and . : it rises toward 22 but never reaches it (like a cold drink warming to room temperature).
Worked example
P3. : 0, 1, 2, 3, 4 and : 5, 8, 14, 26, 50. Find the model.
Answer: Differences 3, 6, 12, 24 have ratio 2, so . gives , and . .
Common slips
“The first data point is 250, so .”
In a regression model, a is the value the model gives at (here about 253.844), not the first data value. The model is fitted to all the points at once.
“The model is great, so let's predict month 24: about 4.4 million subscribers.”
The data only covers months 0 to 8. Predicting a little past the data (month 10: about 14,849) is reasonable; predicting far past it assumes the channel keeps growing 50% a month for two years. Real growth usually slows down. Be careful when you extrapolate.
“The coffee's temperature will eventually reach 0 °C.”
The asymptote is . The model says the coffee gets closer and closer to room temperature, which is also what a real cup does. Always ask what value the quantity is approaching, and that is your .
“, the starting temperature.”
In + k, the value at is a + k, not a. So : the part that is actually decaying.
“The ratios of aren't constant, so is not exponential.”
That only rules out with asymptote . When the ratio test fails, check whether the differences have a constant ratio. If they do, the function is exponential with a vertical shift.
Lock it in
Try the flashcards
18 cards · Linear or exponential?, Exponential models
Recap card
5 lines to re-read the night before.
- 01
Real data is rarely perfectly exponential. If the ratios over equal intervals are nearly constant, an exponential model is appropriate.
- 02
Exponential regression (ExpReg) finds the closest to all the data; a is the model's value at 0, not the first data value. Far extrapolation is risky.
- 03
has asymptote . In context, is the value being approached, and a is the starting gap.
- 04
Without context: if the differences have a constant ratio, that ratio is , the first difference is , and .
- 05
Next, in 2.6: when data could be linear, quadratic, or exponential, how do you decide? Residuals will tell us.