
Topic 2.3
Exponential Functions
In 2.2, Nova's subscriber count became the function . Now we step back and study the whole family that belongs to. Not every exponential function grows: a cup of coffee is a good example of one that shrinks. After you drink 160 mg of caffeine, your body removes about 13% of whatever is left every hour, so the amount left after hours is
13 MIN READ9 IDEAS33 PROBLEMS14 flashcards
Nova and caffeine look like opposites, one exploding and one fading away, but they are built the same way. This note is about what every function of that shape has in common, and what makes them different.
What Counts as an Exponential Function?
CONCEPT
Definition
An exponential function has the form , where and are constants with , , and .
a is the initial value: , so a is the y-intercept.
is the base, or growth factor: every time goes up by 1, the output is multiplied by .
Each restriction has a reason. If , the function is just 0 everywhere. If , then and is the constant a: no change at all. If were negative, as you saw in 2.2, values like would not be real numbers, so the function would have holes almost everywhere.
COMMON MISTAKE
“In , the base is −2.”
Exponents are applied before the negative sign, so means −(). The base is 2 and . At this gives −4, while would be 4. When the negative sign belongs to the base, the parentheses are written: , which is not an exponential function.
Worked example
Example 1. Which of these are exponential functions? (a) (b) (c) (d) (e)
- 01
(a) Yes: , (positive, not 1). (b) No: the VARIABLE is the base and the exponent is fixed. That's a power function (a cubic), not an exponential.
- 02
(c) No: the base is negative. (d) No: , so for every . That's a constant function.
- 03
(e) Yes: , so and . A negative sign in the EXPONENT is allowed; it just means decay (more in 2.4).
Growth or Decay?
With , the base alone decides the direction.
CONCEPT
Growth and Decay
: exponential growth. Each step multiplies by more than 1, so the outputs increase.
: exponential decay. Each step multiplies by less than 1, so the outputs decrease.
Writing turns the base into a percent. Nova: , so 50% growth per month. Caffeine: , so 13% decay per hour.
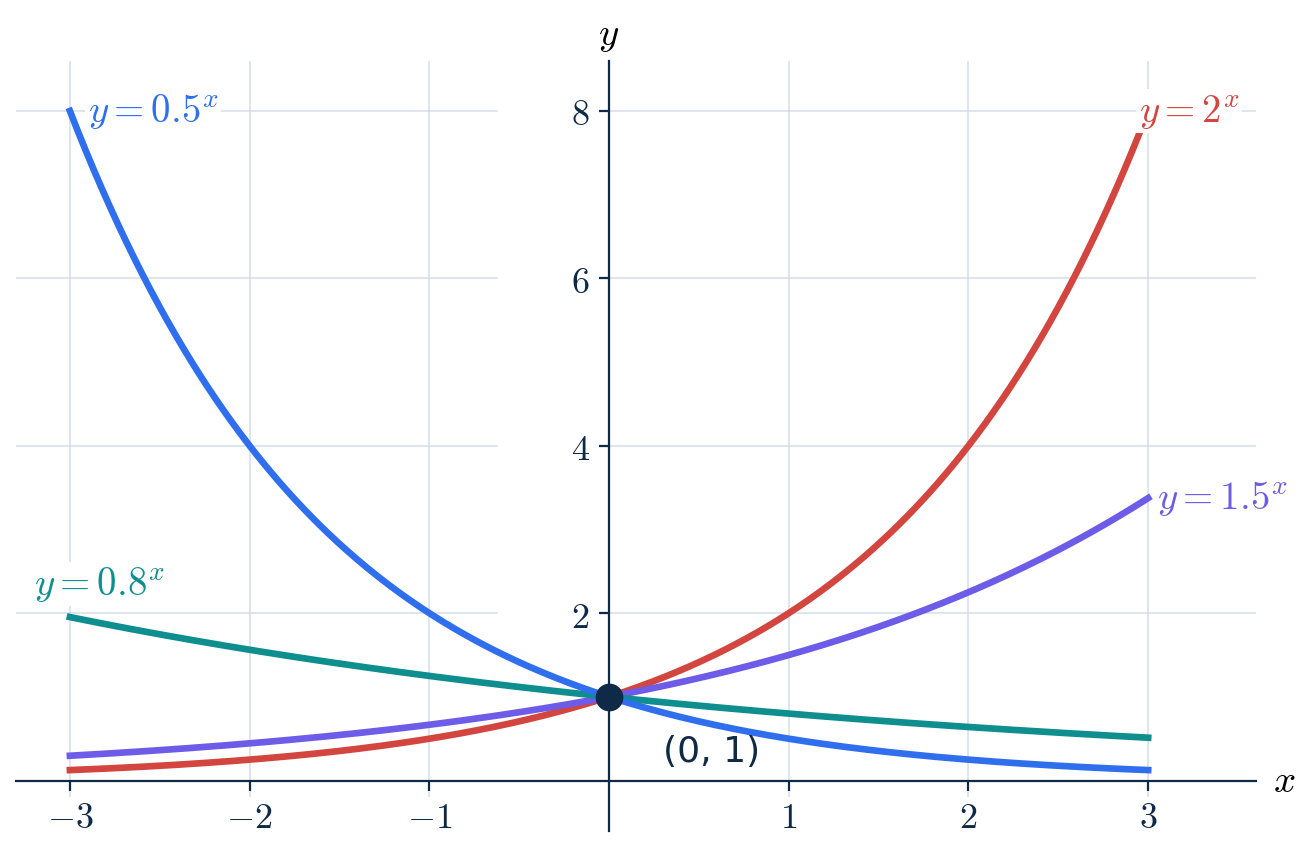
Four exponential functions with . All pass through . The bases 2 and 1.5 grow; 0.8 and 0.5 decay. Notice is the mirror image of , because .
COMMON MISTAKE
“, so the caffeine drops by 87% each hour.”
The base is what REMAINS, not what is lost. Multiplying by 0.87 keeps 87% and removes 13%. Check: mg, a drop of 20.8 mg, which is 13% of 160.
The Shape of the Graph
CONCEPT
Features of
Domain: all real numbers. You can raise a positive base to any power.
Range: when , and when . The output is never 0.
Horizontal asymptote: . On one side the outputs get closer and closer to 0 without reaching it.
Always increasing or always decreasing, so there are no maximums or minimums.
Always concave up or always concave down, so there are no points of inflection.
Why is the output never 0? Because , every power is positive. Even is tiny but still positive. The graph gets as close to the x-axis as you like, but it never lands on it.
Why concave up? Remember from 2.2 that equal intervals give equal ratios. For caffeine, the drops over consecutive hours are −20.8, −18.096, −15.744, … The drops get smaller, so the rate of change is increasing, which is exactly what concave up means (Remember from Unit 1). Nova's gains get bigger (+128, +192, +288, …), so its rate is also increasing: concave up too.
| t (hours) | 0 | 1 | 2 | 3 |
|---|---|---|---|---|
| C(t) (mg) | 160 | 139.2 | 121.104 | 105.36 |
| change | — | −20.8 | −18.096 | −15.744 |
COMMON MISTAKE
“Eventually the caffeine hits 0, so the graph crosses the x-axis.”
The model never reaches 0: after 24 hours mg, and stays positive for every . The line is an asymptote, not an x-intercept. (In real life the amount becomes too small to matter, but the model itself never gets there.)
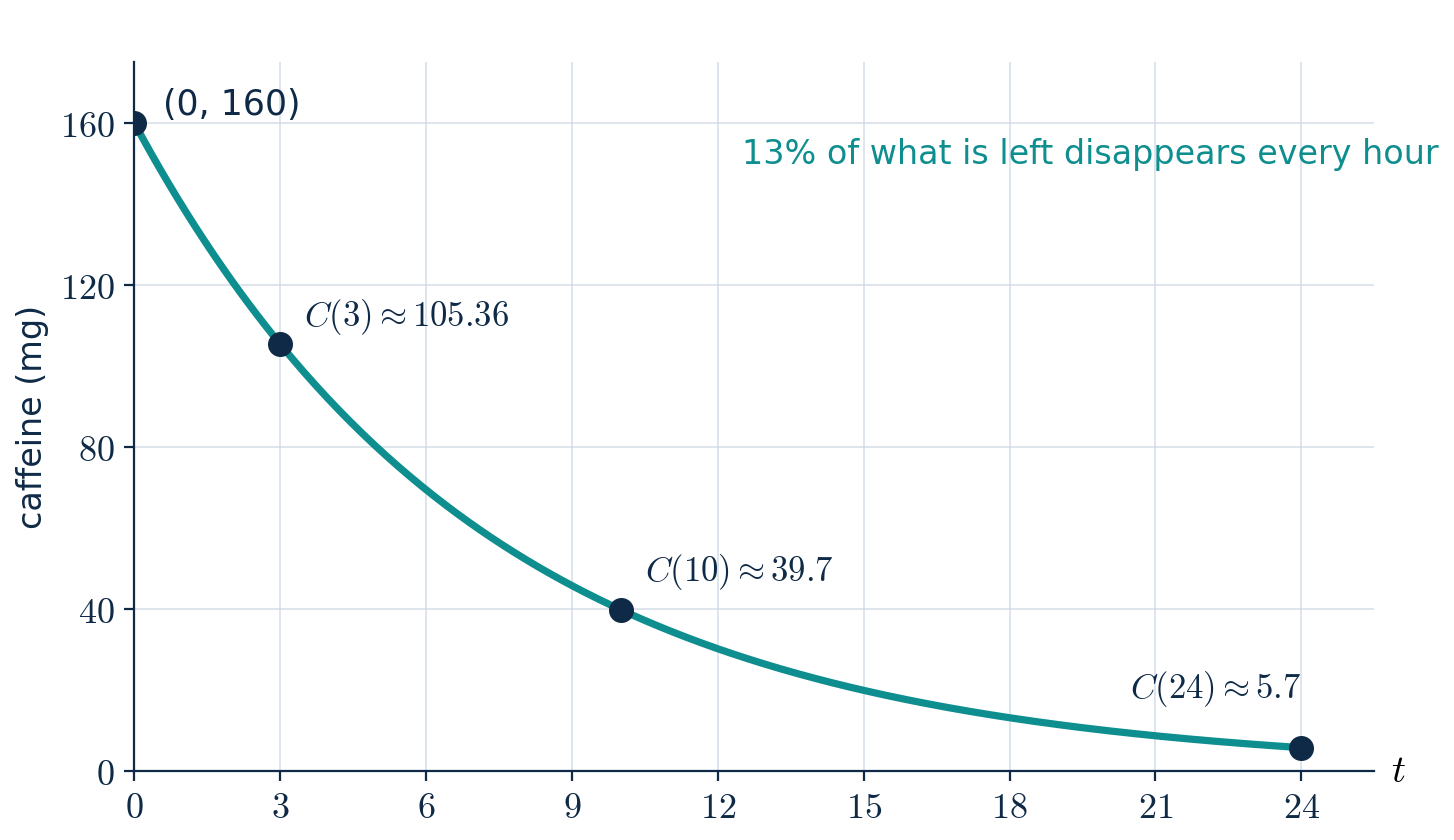
keeps decreasing toward but stays above it.
Worked example
Example 2. An exponential function has , , , . Write and describe its graph.
- 01
. The ratio of consecutive outputs is each time, so and .
- 02
and : growth by 50% per unit, increasing, concave up.
- 03
Domain all real numbers, range , asymptote on the left (as → −∞), y-intercept .
When a Is Negative
A negative a flips the graph over the x-axis. That swaps increasing with decreasing, swaps concave up with concave down, and makes the range . The four combinations:
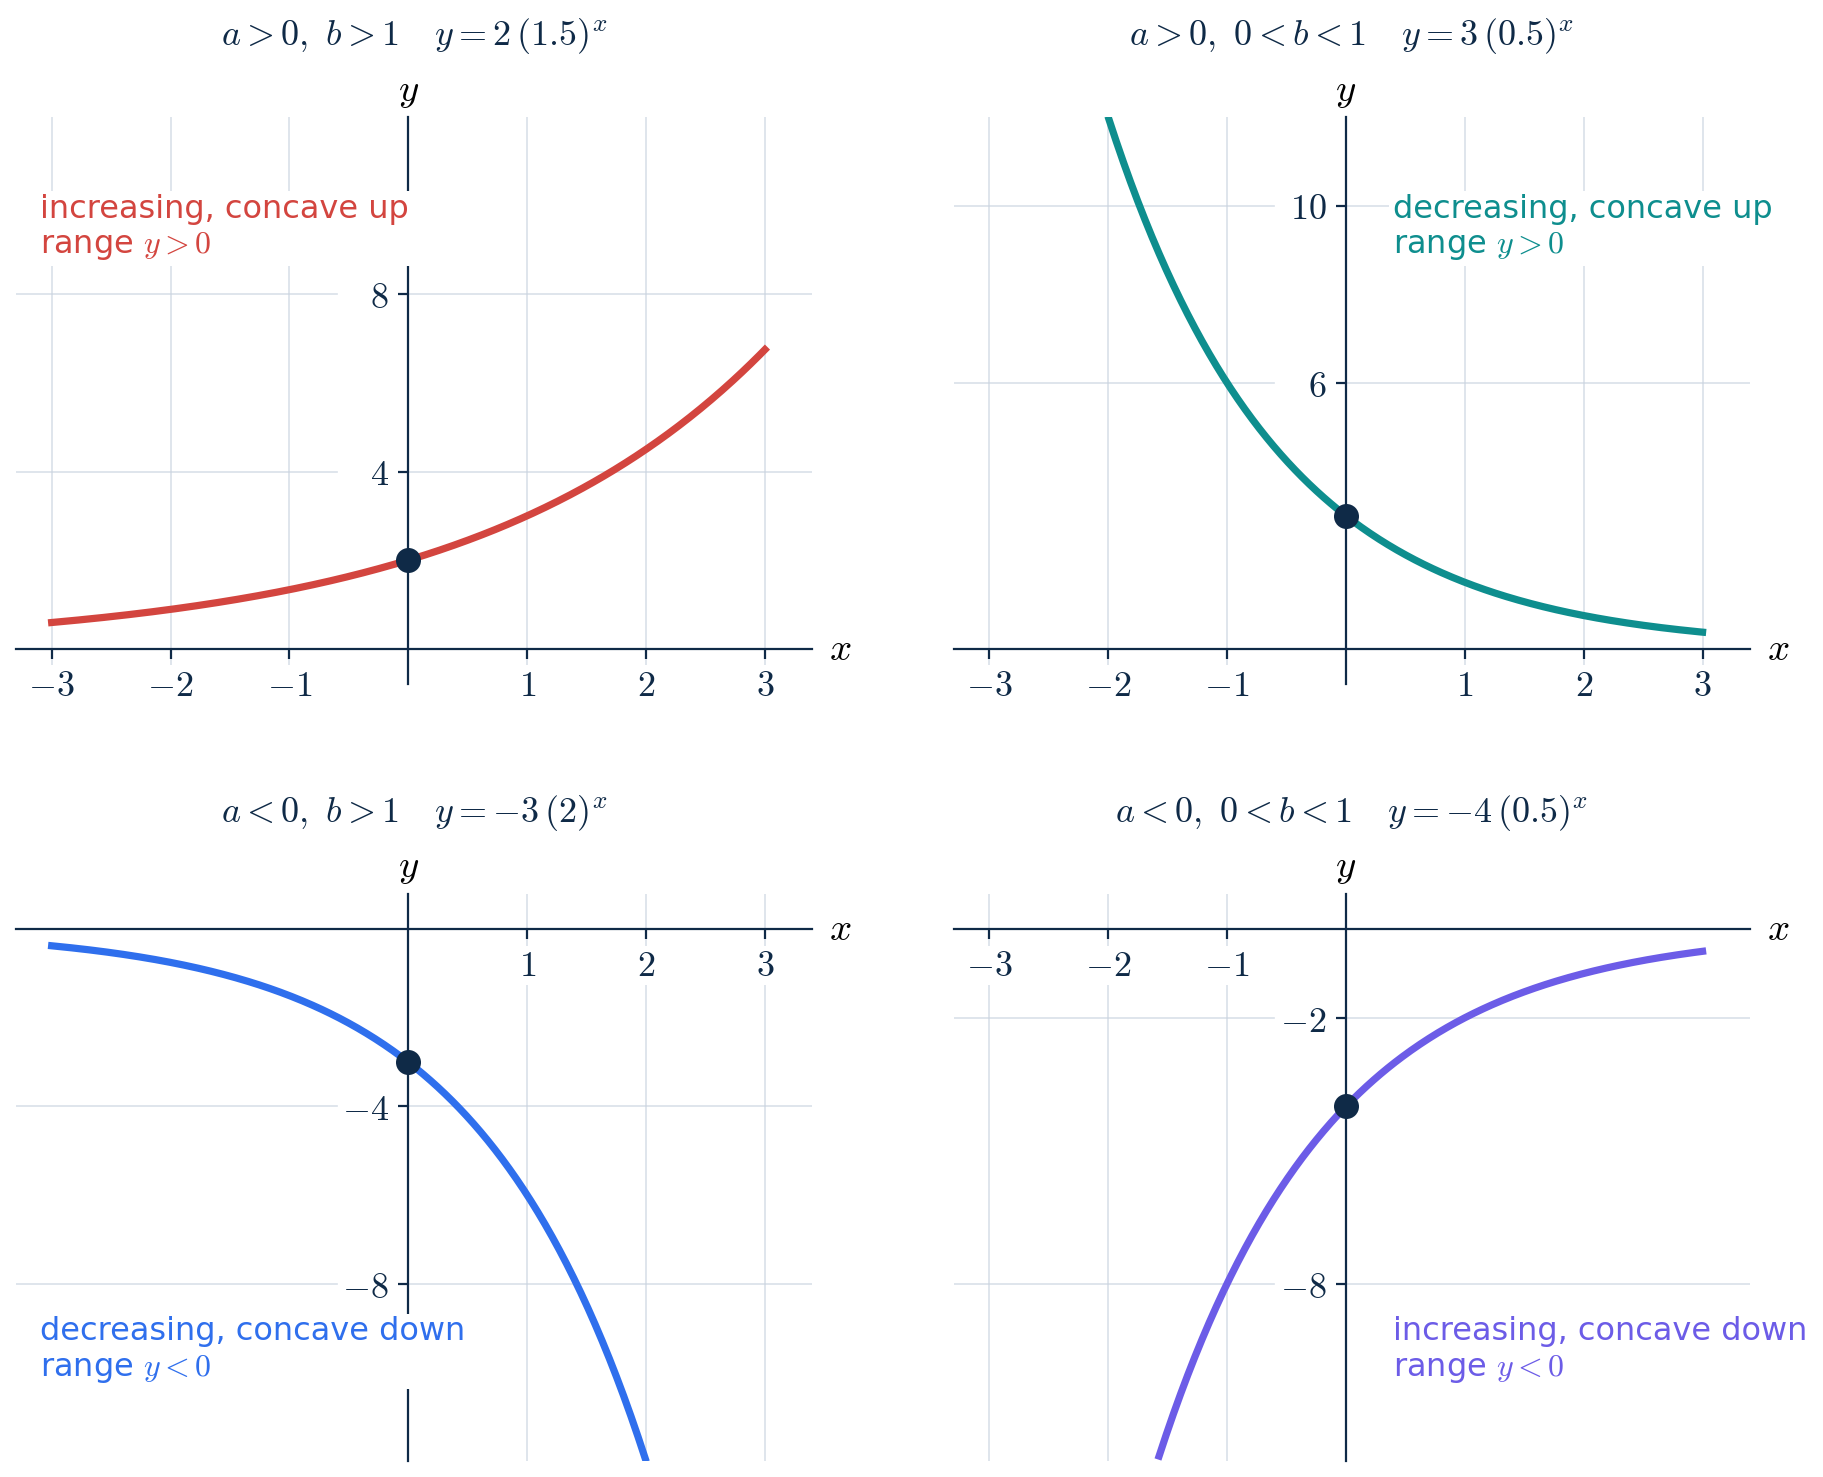
The sign of a and the size of together decide the direction and the concavity.
| b > 1 | 0 < b < 1 | |
|---|---|---|
| a > 0 | increasing, concave up | decreasing, concave up |
| a < 0 | decreasing, concave down | increasing, concave down |
A quick way to remember it: concavity follows the sign of a ( → concave up, → concave down), and the function is increasing exactly when a and have the same sign.
COMMON MISTAKE
“ is going down, so it is exponential decay.”
It is decreasing, but that is not decay. Decay means the outputs shrink toward 0 as increases, which needs . Here , so the size of the output grows: −3, −6, −12, … are getting farther from 0. Decreasing and decaying are not the same thing.
Quick check
Is increasing or decreasing, and which way is it concave?
End Behavior
CONCEPT
Reading Limit Notation
“x → ∞” is read “x goes to infinity”: keeps getting bigger without stopping (10, 100, 1000, …). “x → −∞” means keeps getting more negative (−10, −100, −1000, …).
“lim as → ∞” (written with “lim” and the arrow underneath) says: as keeps growing, the outputs get as close to as you like.
If the outputs grow without bound instead, we write that the limit is ∞ (or −∞ if they head down forever). The limit is not a number there; it describes the direction.
End behavior describes what the outputs do as → ∞ (far right) and as → −∞ (far left). For an exponential function, one side always goes to 0 (the asymptote) and the other side grows without bound, toward ∞ or −∞.
Worked example
Describe the end behavior of and using limits.
- 01
, to the right: and , so is decay. Multiplying by 0.4 again and again shrinks the output toward 0: .
- 02
, to the left: negative exponents flip the base, because . So , and the outputs grow without bound.
- 03
: and . The size of grows to the right, and the negative sign sends it downward. To the left, shrinks to 0, so approaches 0 from below.
- 04
Check with the y-intercepts: and . The graph of lies entirely above and the graph of entirely below.
Worked example
Try it yourself. For , give the y-intercept, whether is increasing or decreasing, its concavity, its range, and both end-behavior limits.
Answers: . Increasing ( and ): , , . Concave down. Range . As → ∞, → 0; as → −∞, → −∞.
Quick check
What does do as , and as ?
Add to the Input, Multiply the Output
Here is the property from 2.2 written as algebra. If you add to the input of an exponential function, the output gets multiplied by :
For Nova, 3 more months always multiplies the audience by , no matter when you start. From month 2 to month 5: . This is what “an additive change in the input produces a multiplicative change in the output” means.
A Special Base: e
One base shows up so often in science and finance that it has its own letter. Look at what happens to as gets bigger:
| n | 1 | 10 | 100 | 1,000 | 1,000,000 |
|---|---|---|---|---|---|
| 2 | 2.59374 | 2.70481 | 2.71692 | 2.71828 |
Where does come from? Imagine $1 earning 100% interest per year. Paid once, you end with $2. Split into 12 monthly payments of each, and each payment also earns on the earlier ones: ≈ $2.613. Daily: ≈ $2.7146. The more often the growth is applied, the closer you get to , but you never pass it.
The values settle down toward a number called , the natural base. Like , it is irrational. The function is an exponential growth function whose graph sits between and , and everything in this note applies to it. You will use much more when natural logarithms appear in 2.9.
Practice
Worked example
P1. . Identify the initial value, and state whether shows growth or decay and by what percent per unit of .
Answer: Initial value 2500. , so 4% growth per unit.
Worked example
P2. . Give the y-intercept, the horizontal asymptote, and both end-behavior limits.
Answer: y-intercept 7, asymptote . As → ∞, → 0; as → −∞, → ∞.
Worked example
P3. An exponential function has , , . Write , state the percent change per unit, and find .
Answer: Ratios , so : 25% decay per unit. .
Worked example
P4. . Is increasing or decreasing? What is its range? Is it exponential decay?
Answer: and : increasing (−6, −3, −1.5 at , 0, 1), range . It IS decay: the size of the output shrinks toward 0 as increases, even though the values are rising.
Common slips
“In , the base is −2.”
Exponents are applied before the negative sign, so means −(). The base is 2 and . At this gives −4, while would be 4. When the negative sign belongs to the base, the parentheses are written: , which is not an exponential function.
“, so the caffeine drops by 87% each hour.”
The base is what remains, not what is lost. Multiplying by 0.87 keeps 87% and removes 13%. Check: mg, a drop of 20.8 mg, which is 13% of 160.
“Eventually the caffeine hits 0, so the graph crosses the x-axis.”
The model never reaches 0: after 24 hours mg, and stays positive for every . The line is an asymptote, not an x-intercept. (In real life the amount becomes too small to matter, but the model itself never gets there.)
“ is going down, so it is exponential decay.”
It is decreasing, but that is not decay. Decay means the outputs shrink toward 0 as increases, which needs . Here , so the size of the output grows: −3, −6, −12, … are getting farther from 0. Decreasing and decaying are not the same thing.
Lock it in
Try the flashcards
14 cards · Exponent rules, Linear or exponential?
Recap card
4 lines to re-read the night before.
- 01
An exponential function is with , , . is the initial value; is the factor per unit of .
- 02
With : is growth, is decay. gives the percent change per unit.
- 03
Domain: all reals. Range: or . Horizontal asymptote ; the graph never touches it.
- 04
Always increasing or always decreasing, and always concave up () or concave down (): no extrema, no inflection points. End behavior: one side → 0, the other → ∞ or −∞. Adding to the input multiplies the output by . is the natural base: the limit of . Next, in 2.4: the same function can be written in many forms. We will rewrite Nova's monthly factor as a weekly one and use the exponent rules to change bases.