
Topic 2.14 · CED: Logarithmic Function Context and Data Modeling
Logarithmic Context and Data Modeling
Some quantities keep growing but slow down more and more: the first $100 spent on ads brings many new viewers, the next $100 brings fewer. Others, like loudness or earthquake strength, are measured on scales that squeeze enormous ranges into small, readable numbers. Both situations are described by logarithmic models.
8 MIN READ5 IDEAS33 PROBLEMS9 flashcards
Remember from 2.11: logarithmic data has a signature. When the input is MULTIPLIED by a constant, the output ADDS a constant. Exponential data (2.5) is the reverse: add to the input, multiply the output.
When Is a Logarithmic Model Appropriate?
CONCEPT
Signs of a Logarithmic Situation
The output keeps increasing (or decreasing) but more and more slowly: diminishing returns. The graph looks like the concave down curve of from 2.11.
Equal FACTORS in the input give equal CHANGES in the output (for example, every doubling adds about the same amount).
The input spans several powers of 10, and the output is a small, readable number: loudness, earthquake magnitude, acidity.
| model | what the data does |
|---|---|
| linear (2.2) | equal x-steps → equal ADDED amounts |
| exponential (2.5) | equal x-steps → equal MULTIPLIED factors |
| logarithmic | equal x-FACTORS → equal ADDED amounts |
Loudness in Decibels
Sound is energy hitting your ear. Its intensity I is measured in watts per square meter (W/m²). The quietest sound a typical human ear can detect has intensity W/m². A rock concert can be a trillion times more intense than that. To keep the numbers manageable, loudness is reported in decibels (dB):
Read it in two steps. says how many times more intense the sound is than the quietest audible sound. Then turns that huge ratio into a small number: each factor of 10 becomes +10 dB.
| intensity I | ||||
|---|---|---|---|---|
| ratio I/ | 1 | |||
| level L (dB) | 0 | 60 | 70 | 80 |
Worked example
Example 1. (a) A hair dryer has intensity W/m². How loud is it in dB? (b) A lawn mower is 90 dB. What is its intensity? (c) How many times more intense is an 85 dB street than a 60 dB conversation?
- 01
(a) Substitute into the formula:
- 02
(b) Work backwards. Divide by 10, then undo the log with a power of 10:
- 03
(c) The difference is dB, which is 2.5 factors of 10: times as intense. Differences in dB become RATIOS in intensity.
COMMON MISTAKE
“Two 60 dB speakers together make 120 dB.”
Two speakers DOUBLE the intensity, and doubling adds only dB. Two speakers give about 63.01 dB:
Remember from 2.9: earthquake magnitude works the same way, with each +1 meaning ×10 in ground motion. And acidity uses pH = : each step down in pH is 10 times more acidic.
Quick check
Sound A is 30 dB louder than sound B. How many times more intense is A?
Fitting a Logarithmic Model to Data
Nova tried different weekly ad budgets and recorded the new subscribers each week:
| budget x (dollars) | 50 | 100 | 200 | 400 | 800 | 1600 |
|---|---|---|---|---|---|---|
| new subscribers y | 120 | 175 | 232 | 290 | 342 | 401 |
Worked example
Example 2. Decide what kind of model fits Nova's ad data.
- 01
The budgets DOUBLE each time (equal factors).
- 02
The outputs change by +55, +57, +58, +52, +59: roughly the same amount each time (equal additions).
- 03
Equal factors in → equal additions out. That is the logarithmic signature, so use .
Worked example
Example 3 (by hand). Build a model from two data points, and .
- 01
Treat as the input. Then is a slope: change in over change in :
- 02
Find a from either point: .
- 03
Model: . Test it at : about 397.7 (actual: 401). Close, but it only used two points.
Worked example
Example 4 (regression). Use all six points.
- 01
Logarithmic regression fits to all the data. TI-84: enter in L1 and in L2, then STAT → CALC → LnReg. Desmos: put the data in a table (, ) and type ~ . Both give:
- 02
At this gives about 400.3, closer to the actual 401. The residuals (0.3, −0.8, 0.1, 1.9, −2.2, 0.7) show no pattern, so the model is appropriate (2.6).
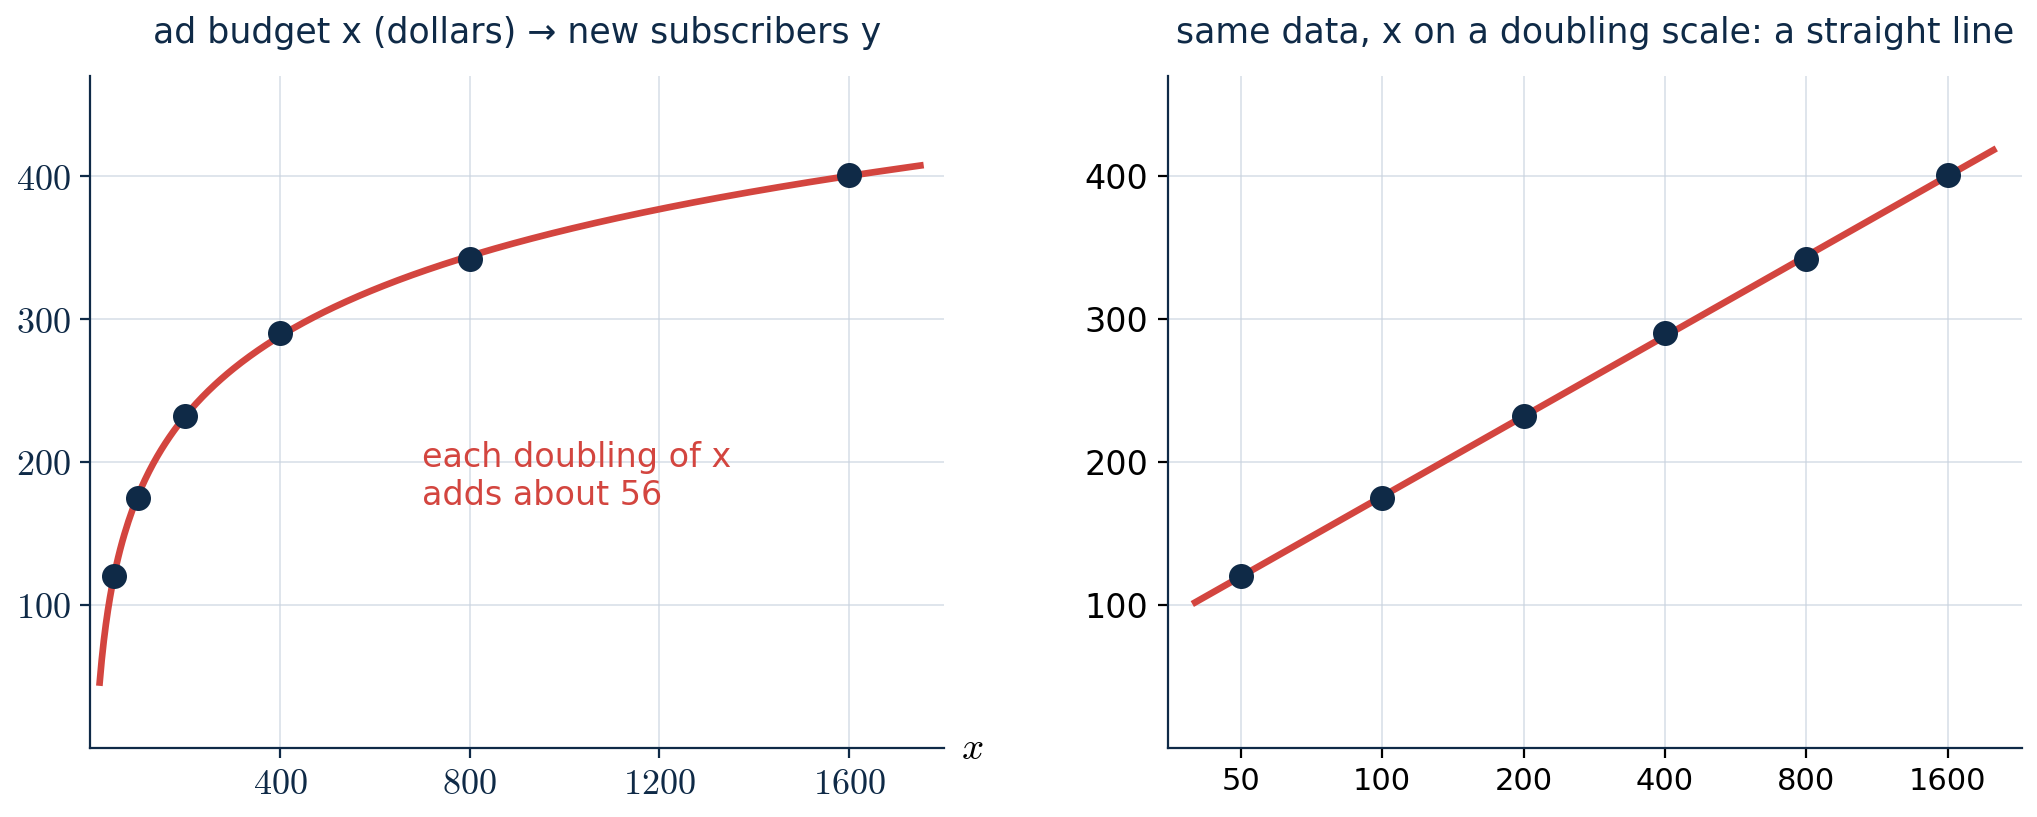
Left: diminishing returns. Right: with the budget on a doubling scale, the same points lie on a straight line (the idea behind 2.15).
CONCEPT
Interpreting
: the change in when is multiplied by . That's awkward to say, so convert: each DOUBLING adds subscribers, and each ×10 adds .
a: the model's value at (because ). Here means nothing in context; a $1 budget is far outside the data.
Prediction: doubling the top budget to $3,200 gives about 456.4 new subscribers, only about 55 more for an extra $1,600. That is diminishing returns in numbers.
COMMON MISTAKE
“, so each extra dollar brings about 81 subscribers.”
In a logarithmic model, is the change per MULTIPLICATION of the input by , not per unit. Adding $1 to an $800 budget changes almost nothing.
“The model works for small budgets too: at $5, .”
Negative subscribers make no sense. As → ( shrinking toward 0 through positive values), → −∞, so the model breaks down below about $11.4, where it predicts 0. Use it only within, or just beyond, the range of the data.
Quick check
A table has inputs with outputs . Find for .
Practice
Worked example
P1. (a) What is the dB level of a sound with intensity W/m²? (b) A siren is 110 dB. What is its intensity?
Answer: (a) dB. (b) , so W/m².
Worked example
P2. How many times more acidic is a solution with pH 6.5 than one with pH 8.5?
Answer: 2 pH steps: times.
Worked example
P3. A logarithmic model passes through and . Find and , and predict at .
Answer: , . At : about 100.0. (Each ×10 adds 40.)
Worked example
Try it yourself. Acidity is measured by pH = . (a) What is the pH when [] = ? (b) How many times more acidic is pH 3 than pH 5?
Answers: (a) . (b) Two pH steps is a factor of in [], so pH 3 is 100 times more acidic.
Common slips
“Two 60 dB speakers together make 120 dB.”
Two speakers double the intensity, and doubling adds only dB. Two speakers give about 63.01 dB:
“, so each extra dollar brings about 81 subscribers.”
In a logarithmic model, is the change per multiplication of the input by , not per unit. Adding $1 to an $800 budget changes almost nothing.
“The model works for small budgets too: at $5, .”
Negative subscribers make no sense. As → ( shrinking toward 0 through positive values), → −∞, so the model breaks down below about $11.4, where it predicts 0. Use it only within, or just beyond, the range of the data.
Lock it in
Try the flashcards
9 cards · Log rules and equations
Recap card
6 lines to re-read the night before.
- 01
Logarithmic models fit diminishing returns and quantities measured on scales spanning powers of 10.
- 02
Signature: multiplying the input by a constant adds a constant to the output.
- 03
Decibels: , W/m². ×10 intensity = +10 dB; ×2 intensity ≈ +3.01 dB. dB differences are intensity ratios.
- 04
from two points: b = Δy / Δ(). LnReg uses all the points. Per doubling, the change is .
- 05
Log models break down as → ; don't extrapolate far below the data.
- 06
Next, in 2.15: semi-log plots, where exponential data turns into a straight line.