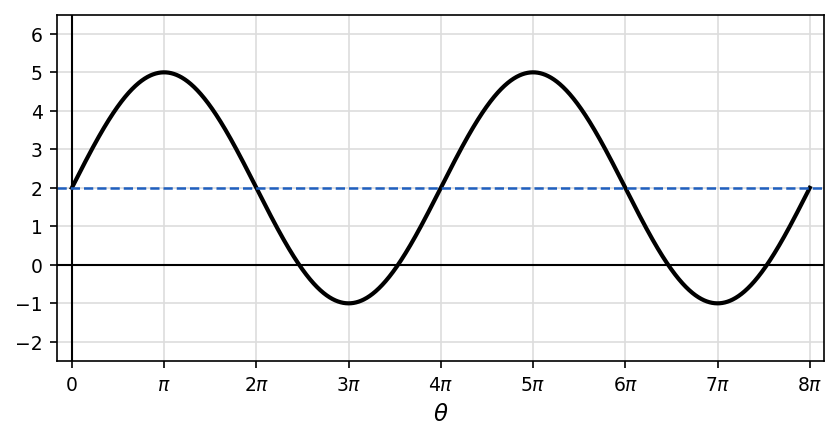
Q4Topic 3.5EasyMark for reviewAP PrecalculusThe figure shows the graph of a sinusoidal function. Its maximum value is 55, its minimum value is −1−1, and consecutive maximums occur at θ=πθ=π and θ=5πθ=5π. What is the period?A2π2πAB5π5πBC4π4πCD66DCheck answer